Massive-Scale Adaptive Querying
SparkLogs allows you to query petabyte-scale datasets in seconds so you can solve your observability problems faster. This is made possible through our unique Massive-Scale Adaptive Querying technology, which automatically activates for every query you run. This ensures that queries will return results in just a few seconds, regardless of the size of the dataset being queried.
Overview
When running queries over billions of events, you either have "needle-in-haystack" queries that may match a tiny portion of overall events (e.g., all matching spans for a globally unique trace ID), or you may have a query that will match billions of events over the entire time range of the query (e.g., searching for a "request completed" message).
Needle-in-haystack queries
For needle-in-haystack queries, the full-text search engine will produce matching results in constant time relative to the size of the dataset. For example, you could query to find the 10,000 matching events for one specific trace ID, and this would be similarly efficient whether you were searching 1 billion or 100 billion log events.
These searches will produce an exact histogram showing precisely the number of matching events for each time bucket. You can also interactively explore log events starting from any point in the histogram, and get an exact list of matching events starting from that point in time.
Queries with billions of matching events
A search index can actually hurt performance if the number of matches is large (e.g., 100s or millions or billions of events). Systems that rely solely on search indexes for queries can encounter challenges for queries with large result sets, including out of memory errors, queries that take minutes to run or abort, and high cost.
Massive-Scale Adaptive Querying technology allows these kinds of queries to run in just a few seconds without issues. It will produce a histogram visually showing the "shape" of the results as well as estimated results for each time bucket. With the interactive histogram, you can then zoom in on specific time ranges of interest, and perform another query to get more precise results for that time range.
Even with this "shaped histogram" you can still interactively explore the log events in the result set, and precisely get a list of all matching events starting from any point in time in the histogram.
This technology quickly gives you the big picture while also making it easy to drill into details of specific matching log events or to get a more precise histogram for a specific time range.
Here is an example of Massive-Scale Adaptive Querying in action, where the query source:backend app:webserver "DB_ENGINE"
matched roughly 6.07 billion events out of 30 billion events over a one month time range:
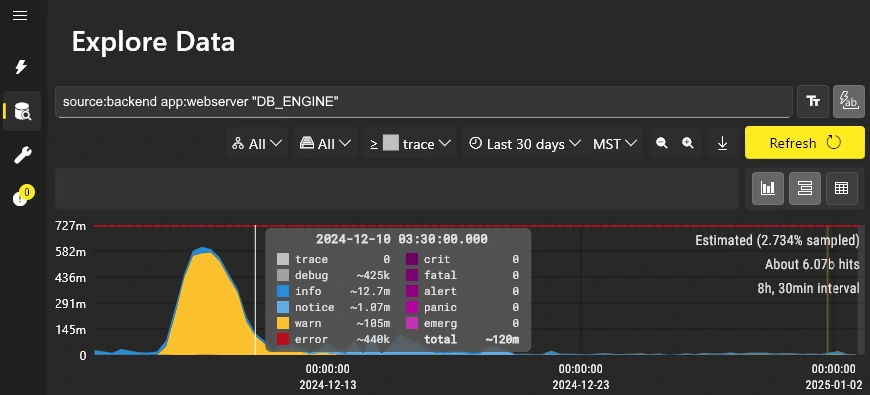
These "shaped histograms" are represented visually by a curved area chart rather than by a stacked bar chart.