Explore Your Data
Overview
Exploring your log data should be fun and fast! We've made it easy to:
- Find what you want with a SQL-like query language that has powerful operators and regexp matching
- Query billions of events in seconds for both "needle-in-haystack" and broad searches
- See histogram graphs of matching events, with dynamic instant zoom
- Quickly find the broader context around a particular log event (e.g., unfiltered logs around an error event)
- Explore custom fields by frequency, and easily filter over them
- Understand the frequency and shape of the common types of matching events (e.g., what are my most common errors?)
- Analyze patterns of values for any custom field in events matching your query (e.g., what is the histogram of http status codes?)
To get started, click the Explore Data sidebar button:
The query bar is at the top, with options to quickly select the desired time range, severity filter, and organization scope.
Each time you perform a query it will create a new history point in your browser navigation, so you can use back/forward to quickly navigate as you explore your log data.
Interactive histogram
The histogram will help you quickly see patterns in query results, including what is the worst severity event for each time bucket, as indicated by the colored indicator at the top of that bucket of time. You can use the mouse wheel or pinch to zoom in on the histogram to see more detail for a particular section of time.
The histogram also shows which events are currently loaded into memory in the detail view (dark blue area) and which events are currently shown on the screen (light yellow area). Tap/click on the histogram to view matching log events for a desired point and time. You can also long press/tap to begin selecting a window of time to zoom into.
Field list pane
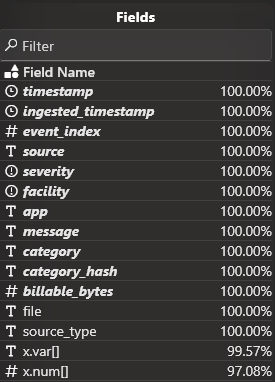
The bottom left area shows a pane with a list of fields, including standard fields,
custom fields, and any auto-extracted fields (these fields will start with x.).
The field type and an estimate of the field frequency is also shown. For example:

You can tap/click any field to copy an LQL expression template to easily filter over that field. For any custom field it will automatically append the proper field type suffix to avoid ambiguities in referring to the field.
Event grid
The bottom area is the event grid displaying events matching the current query. Use the keyboard (arrow keys, home/end), mouse wheel, or gestures to navigate.
The event results grid is dynamic and will load earlier or later events (if available) as you scroll through the result set. It will keep thousands of events loaded into memory around your current exploration point for fast browsing of log data.
By default the event grid shows a single line per log event. You can show multi-line
log events (up to 50 lines) using the button:
Event details pane
An event details pane is on the bottom right to explore the values of all standard and custom fields associated with any given event.
You can double tap an event to show or hide the full details for that event, with all custom fields.
You can also show or hide event details using the button:
Use the detailed event view to search for unfiltered context surrounding the
event using the button:
You can also use the copy button to copy all event details to the clipboard. Long press (or right click) the copy button to show additional format options.
Pattern analysis
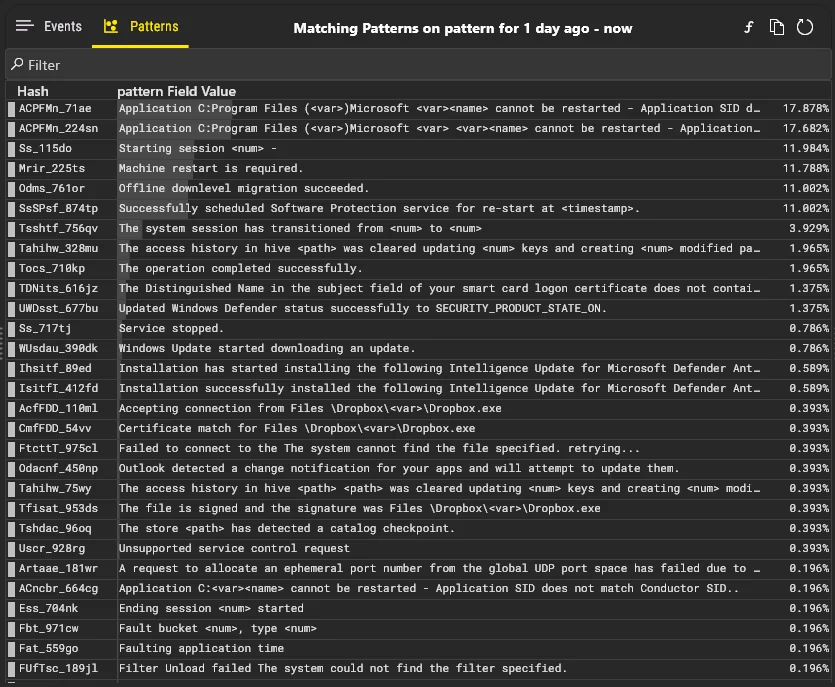
A powerful feature is to use the Patterns tab in the results area to calculate histograms
over any custom field.
AutoClassify populates the pattern field so that you can do an analysis to understand
which log patterns are the most common. For example, you could filter to show only error
events, and then do a pattern analysis to see which errors are the most common.
Here is an example of pattern analysis for all events from OS log events from a desktop system:

You can also choose to do generic pattern analysis over any field by using the button:
For example, you could do a pattern analysis over the x.http.response.status field to understand
the frequency of different HTTP response codes for events matching a certain condition (e.g., for
a particular API endpoint by filtering on x.http.request.url).