Monitoring Ingestion
In large-scale logging systems, logs may be forwarded into SparkLogs from thousands of systems, so it's important to have insights into any systems that are lagging behind or exhibiting unhealthy behaviors, like sending duplicate payloads.
Dashboard
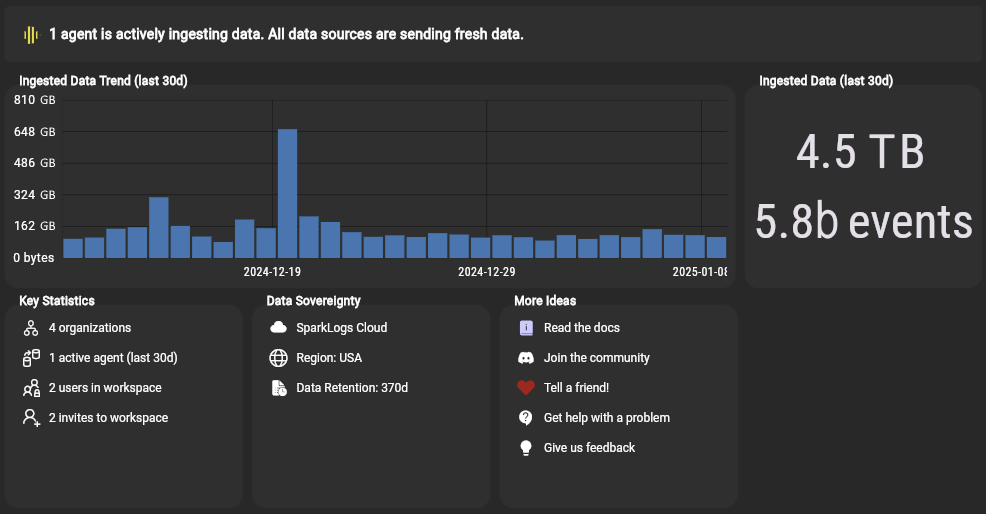
SparkLogs's main dashboard provides a high-level overview of overall ingestion health, including data ingestion trends, how many agents are sending data, and whether or not the data being ingested is fresh and up to date:

Freshness Monitoring
When logs are not being forwarded properly in a timely manner, it can be frustrating and confusing, because log data is missing that you expect to be there. To raise awareness when log sources are struggling to send data, SparkLogs detects if any log sources are sending log data that is not fresh (more than 30 minutes behind the current time at the point of ingestion) or that are sending duplicate payloads (see deduplication).
It will also detect if a given agent was previously ingesting data recently (within the last 7 days), but has not ingested any data within the last 2 hours. This can indicate that the agent was working previously but now is possibly having an issue.
These will show up on the dashboard, and you can then copy the details of lagging systems to further
diagnose the root cause:
A log source that shows signs of lagging will be marked as lagging for 30 minutes from the point of the last lagging event.
You can use LQL to find the individual lagging events (see detailed instructions).
Individual Agent Telemetry
Additionally, each log forwarding tool has its own available telemetry, including metrics and local logs on forwarding health. These should be consulted if there is an issue with a particular log source. Refer to the documentation of the log forwarding agent you are using for more details.