Start the day with actionable root-cause reports for key issues across every client.
IT fleet intelligence delivers a proactive approach to IT operations: Curated data from every endpoint + AI analysis means you can uncover and fix more issues before they impact clients. When your team investigates a ticket, they can start from a full root-cause analysis that considered 1000s of signals instead of starting from a vague ticket description.
Curated endpoint data across your fleet, for proactive fixes and investigations your team can verify.
Prevent IT train wrecks before they happen. Deliver exceptional service at scale.
For MSP owners
better client outcomesFind hidden and sporadic client issues proactively.
Use AI + SparkLogs data to hunt critical problems across any sized fleet. Head off issues before they become client-facing.
Root-cause and permanently fix recurring issues.
Stop repeat tickets caused by only solving symptoms. Find and fix the root-cause. Repeat tickets go down. Client satisfaction goes up.
When an engineer gets an urgent ticket, they can start from a root-cause report, with cited evidence.
Hours of investigative work can be condensed to just a few minutes of AI analysis. Problems get solved faster. And your engineers spend more time on impactful work.
For IT service managers
multiply your capacity + level-up qualityConduct process-driven fleet-wide hunts for priority-defects, new security risks, process violations, and to surface unknown-unknowns.
It's like having your L3 team hunt for issues fleet-wide every day, analyzing 1000s of signals on each device comprehensively. Find client issues earlier. Create more time for L3 to focus on higher-impact work.
Every investigation is rigorous, process-driven, and tailored for you.
The /sparklogs-investigate skill analyzes and reports signals, state, changes and scope. Open-source playbooks and skills can be customized to fit your process and team. Achieve better-informed and more consistent ticket resolution.
Level up your engineering bench.
Give junior engineers a senior-engineer-like AI companion that follows your process and rigorously analyzes all available signals. Reduce misidentification of issues and head off dead-ends in investigations early.
- System log · dirty shutdown
- Storage · disk unresponsive
- Drivers · storage driver updated, Mon
- Firewall logs, not yet collected
- Crash dump, not configured
Capture, curate, and investigate: the pipeline behind the outcomes above.
Continuous collection and curation enable AI-driven fleet-wide analysis. When a ticket needs depth, the same signals power /sparklogs-investigate and interactive chat sessions, with evidence cited behind every claim.
Zero-config capture of all relevant signals across your entire IT fleet
Combine data ingested via the SparkLogs Agent and other data sources (firewalls, appliances, open-source log shippers, and any source that speaks HTTP/OTLP/elastic)
OpenTelemetry-native
Native OTLP/HTTP ingestion for OpenTelemetry logs, JSON and protobuf payloads, eight compression encodings. Works with the OpenTelemetry Collector, every OTel SDK, and any OTLP-compliant shipper. Source, service and app pivot fields are derived from your Resource attributes, with request dedup, clock-drift correction and large payload support.
Automatic syslog parsing
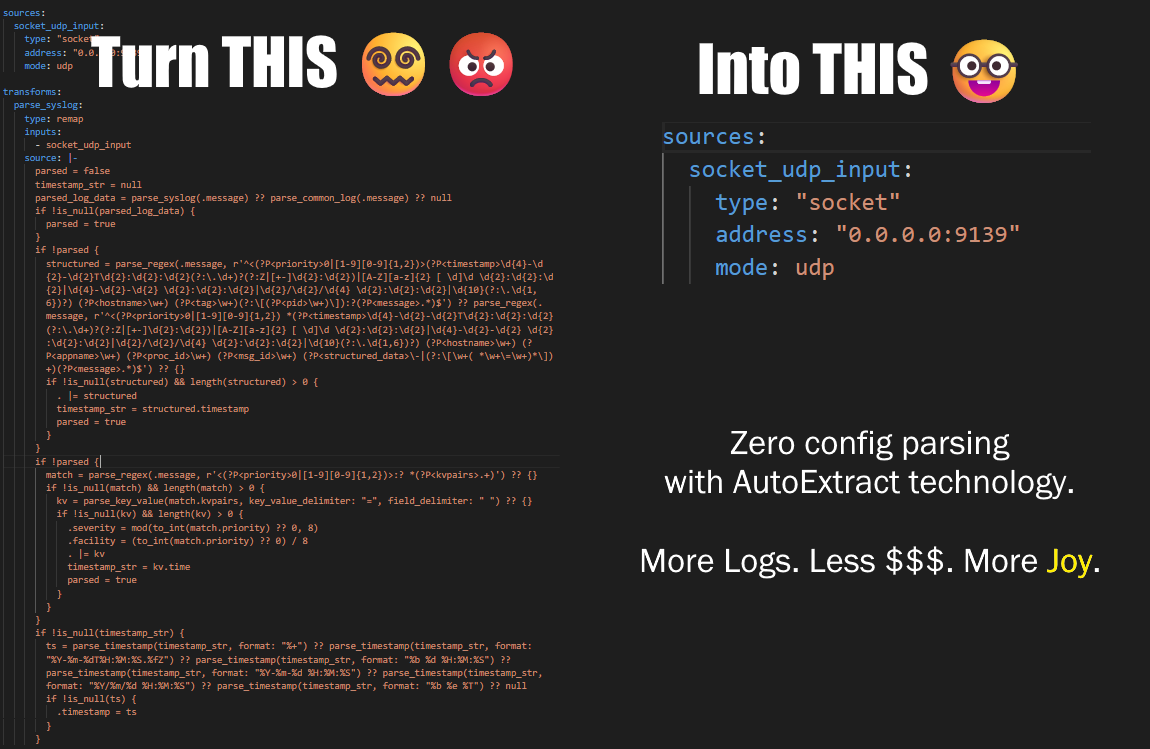
Automatic parsing of syslog data in known and unknown formats with zero configuration: RFC3164 and its many variants, RFC5424, Linux, FreeBSD, and proprietary formats such as Cisco, Juniper, SonicWall, WatchGuard and Fortinet.
Raw events are analyzed in realtime and curated into low-noise, high-quality signals
Each event is grouped into patterns and then classified into named signals with a stable meaning and a graded impact-based severity score. This data enables AI agents to conduct effective root-cause analysis and IT fleet intelligence.
Use AI to find root causes and hunt issues fleet-wide
Connect Claude, Copilot, Cursor, Codex, or your own agents. Run /sparklogs-investigate for a ticket-ready report; each claim links to the data behind it for further inspection.
Petabyte-scale data engine and pipeline
Schemaless ingest with no indexes to configure; query hundreds of billions of events in under 10 seconds; explore with full-text search, adaptive-scale analysis, histogram zoom, pattern analysis, and field pivots. Replicate data to object storage for long-term archival.
Petabyte-scale querying
Analyze datasets with hundreds of billions of events in less than 10 seconds. SQL-like query language with custom fields, array unfolding and advanced operators. A full-text index and adaptive-scale querying gives fast search and exploration over any time scale.
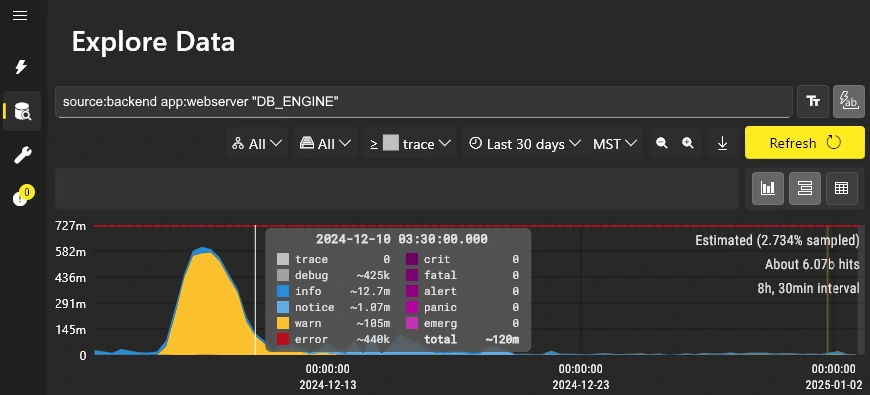
Interactive data exploration
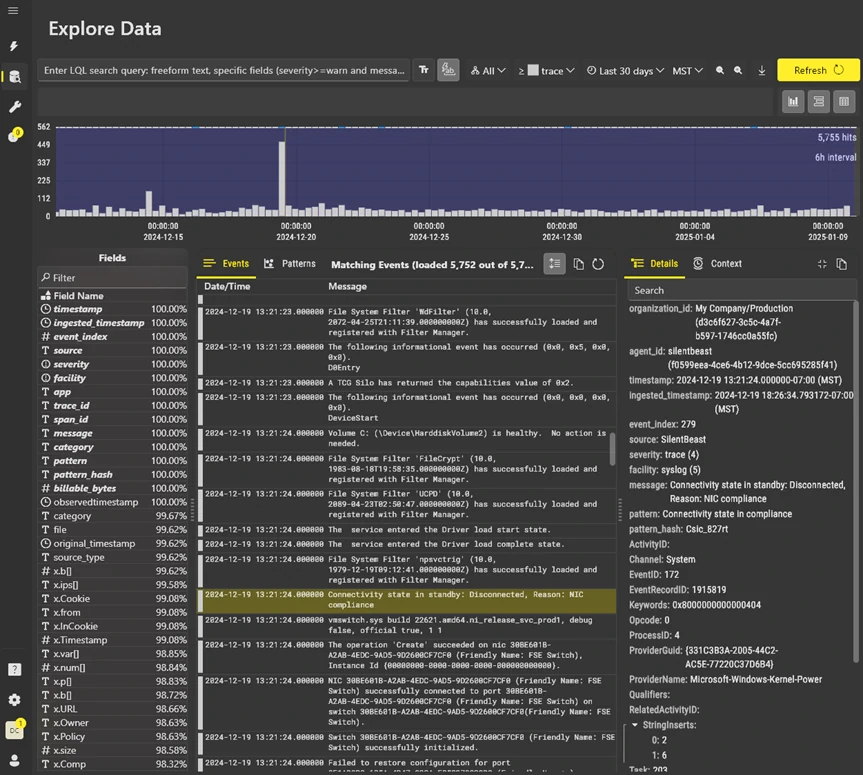
Interactive histogram with live zooming and instant severity filtering. Filter by organization and data source, pivot on any field, scroll events bi-directionally at any point in the window, read a side-by-side context viewer, and copy or download matches with a shareable link. Learn more.
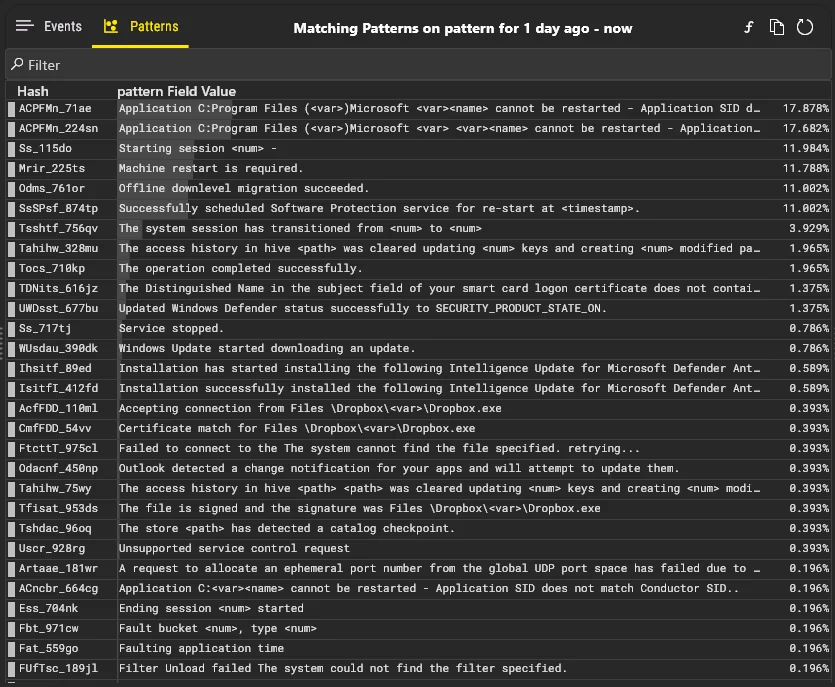
Pattern analysis
Automatically classify log events into prototypical patterns with zero configuration. Identify top application error patterns, pivot to examples in context, and analyze the top 10,000 values for any custom field over any window of time.
Zero config, schemaless, AutoExtract
No indexes to configure, no field schemas, no parsing rules. Infinite custom fields, infinite cardinality, plain text or structured data. AutoExtract structured data from plain text, with automatic category and pattern classification, automatic GeoIP lookups and foreign currency conversion.
Replicate to your data lake or archive
Replicate a copy of all your data to any cloud storage bucket, stored compressed in a ready-to-query Parquet hive-partitioned format. Meet the retention requirements of HIPAA, FINRA, SEC or CFTC while keeping a queryable archive for forensics and analysis.
Browse our curated data feeds, then walk through a recorded investigation with every step cited.
The coverage wall lets you explore our curated signals by source and ticket theme. The demo is an MCP session showing how AI uses these signals for root-cause analysis.
See what we curate for every ticket theme
Log streams, event channels, curated reasons, graded conditions, system metrics (CPU, RAM, IO), system inventory (OS, software, patching, apps, services, drivers), and more.
Open the coverage wallThe observability platform powering IT fleet intelligence.
Ingest everything. Analyze anything. Unified near and long-term storage. Archiving and replication.
Petabytes of O11y Data

Schemaless
Ingestion is "point and shoot": fields don't have to be configured, just send data. Capture complex JSON data with each log event. No field limits.
AutoExtract
Auto-extract semi-structured and JSON data from plain text. Auto-detect field types. Auto-extract IP addresses, timestamps, and bracketed values.
Visual Data Exploration
Visualize patterns across billions of events.
Instant zoom-in, filter, search, and export.
Easily sift through huge query results.

Petabyte Scale
Fully managed in our cloud.
Always on, infinitely scalable.
Ingest Anything
Open-source ingestion agents for files, Kubernetes, syslog, journald, Kafka, Docker, and more.
OpenTelemetry, vector.dev, filebeat, Logstash, Alloy.
Or ingest via REST, OTLP/HTTP, or elasticsearch API.

Enterprise Ready
Data encrypted at rest and in-transit.
SSO in every plan. Role-based access control.
Optionally use your own Google cloud tenant.
Make IT problems die young
- strange IO slowdowns after patch tuesday. why? who's affected?
- we just fixed VPN flakiness on the lakeview ts. anyone else affected?
- bob's account got hacked at 3:43pm. audit everything. impact?
- backups failed on fs-02 three nights running. why?
- why is lakeview file server super slow every afternoon?
- why did dc-01 at northridge reboot at 2am last night?