Collection Health
The SparkLogs Agent reports two things about its own collection: whether it is checking in, and whether each data feed is current. Check both before you read a gap in a device's data as an incident.
Agent status
| Status | Means |
|---|---|
| Online | The agent is online and checking in regularly. |
| Offline | Check-ins stopped and the agent gave no reason. |
| Device shut down, Agent service stopped, Upgrade started and has not finished | The agent stopped for the stated reason. |
| Registered, never checked in | The agent enrolled and has not checked in yet. |
Your RMM is the authority on whether a machine is up. An offline device keeps its last-reported collection state, with the time it was reported.
Data feed health
A data feed is one source the agent collects from the device, such as a group of Windows event logs, the servicing logs, or the device's own state. The agent reports each feed's health. The Data Feed Reference lists every feed and what it collects.
| Health | Means |
|---|---|
| Current | Caught up. |
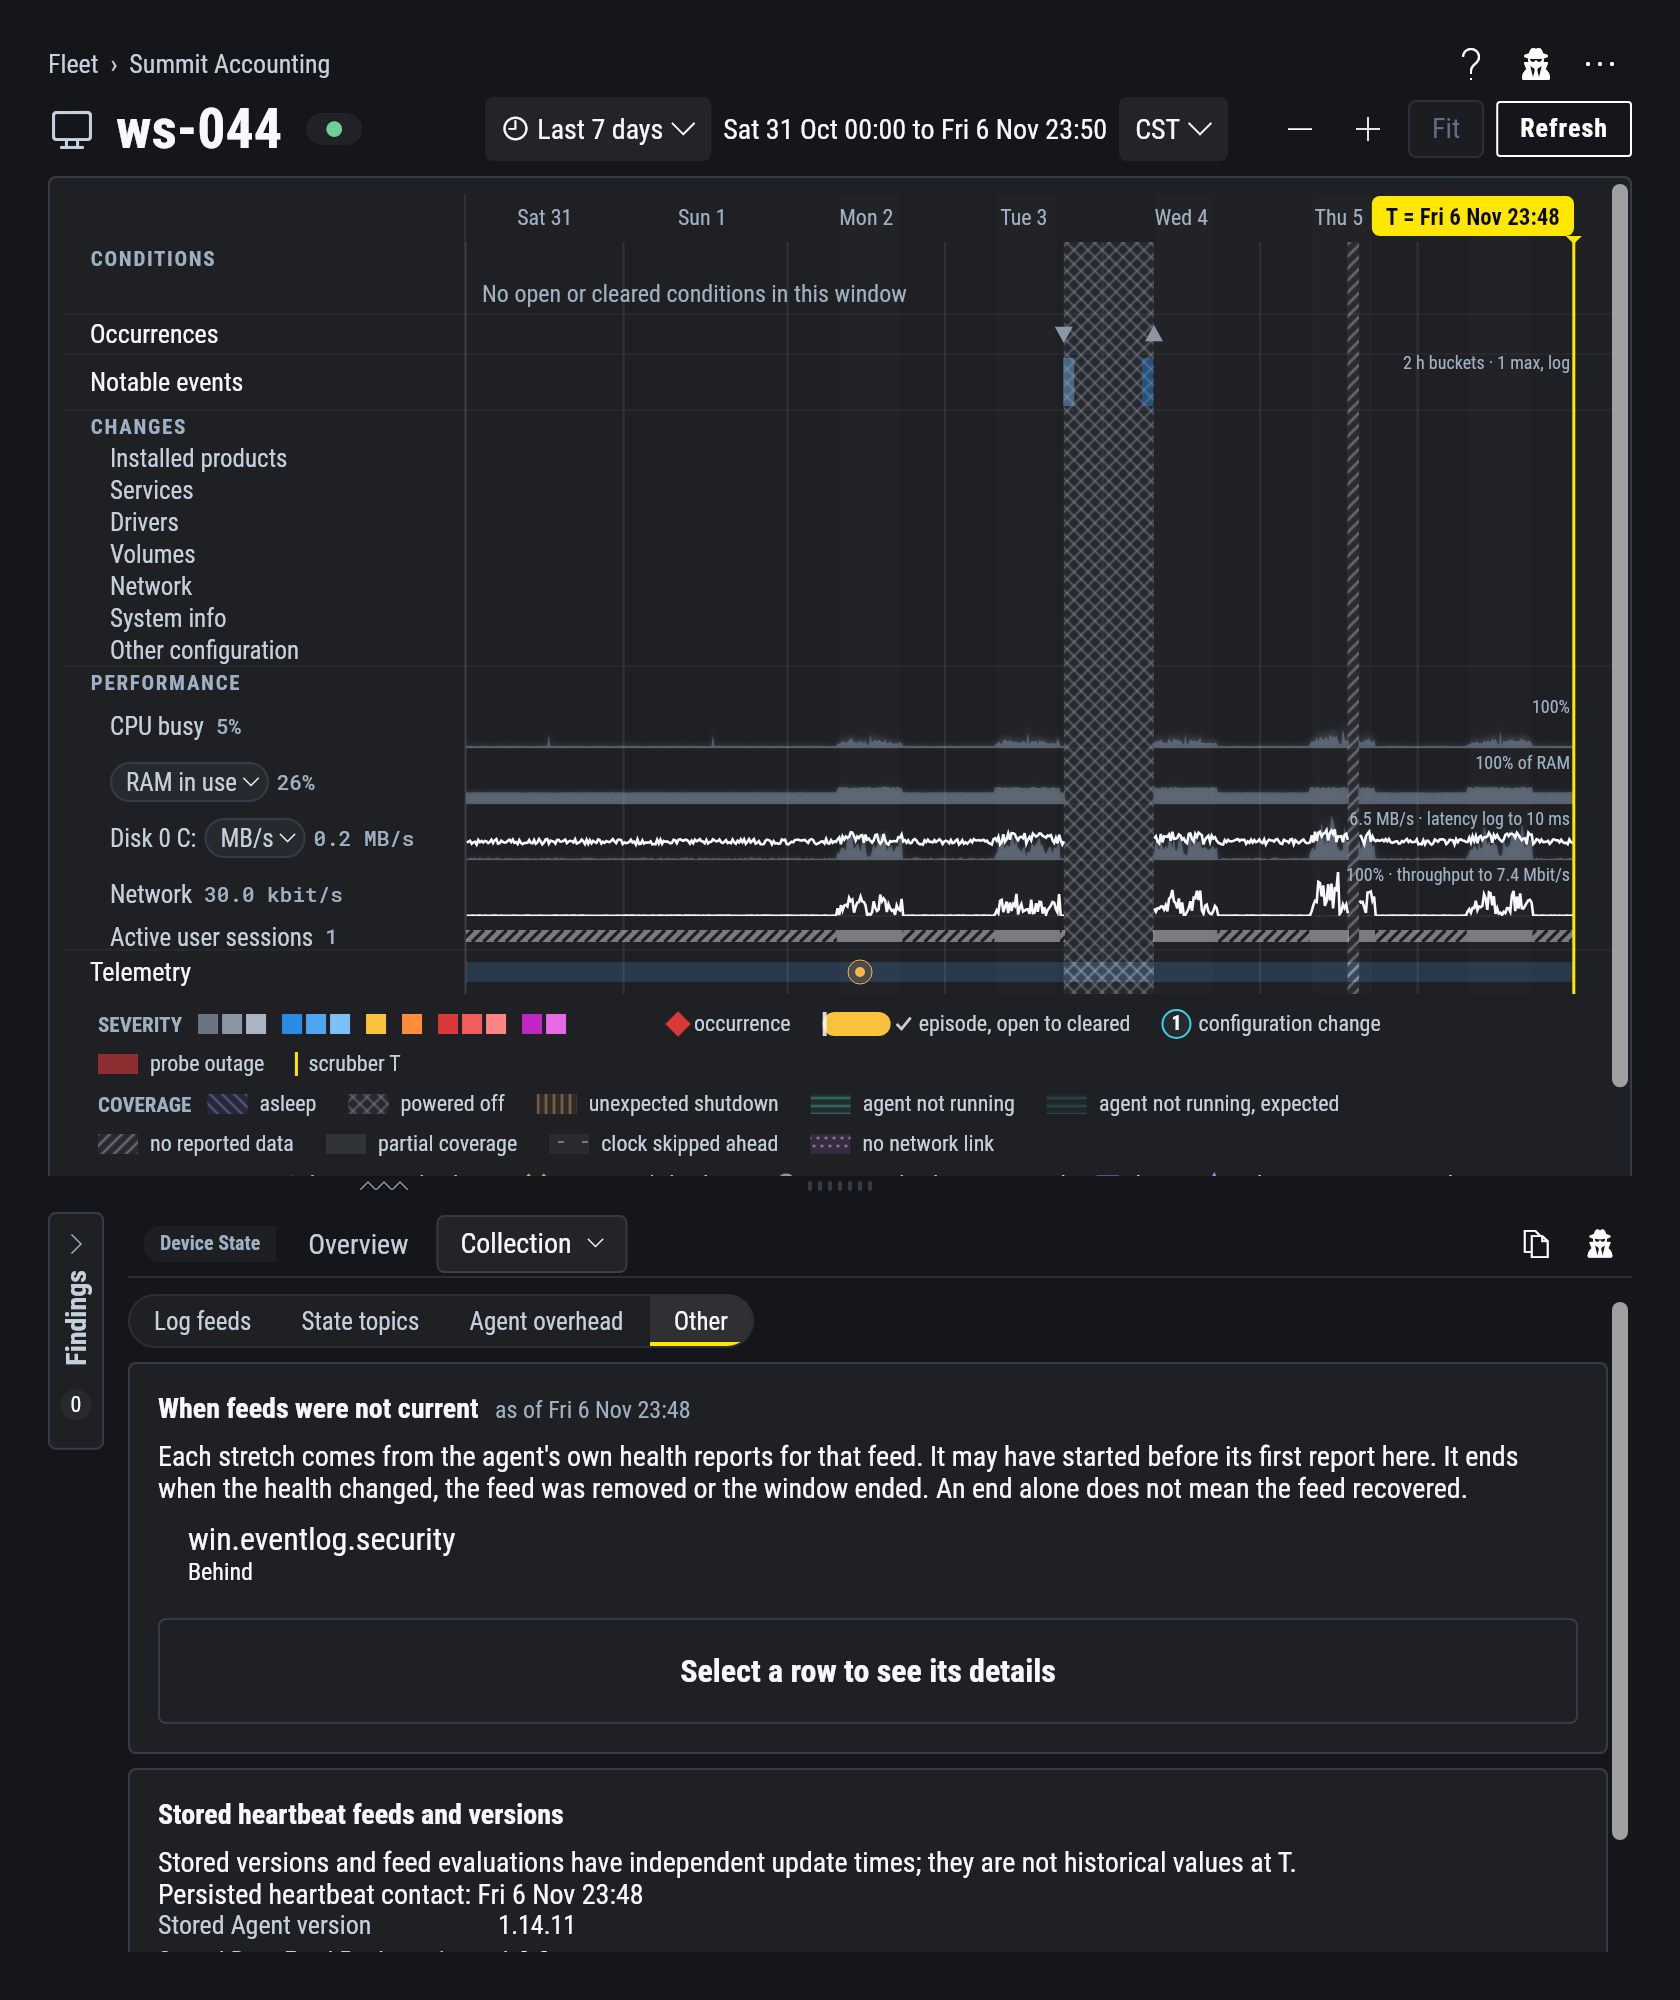
| Behind | Collecting, but not caught up. |
| Stuck | Not advancing. The agent retries on its own. |
| Blocked | Cannot collect until something on the device changes, such as read access to a log. |
| Starting up | Just started, as on a new install. |
| Not evaluated yet | No report yet, so its health is not known. |
For a feed that is not current, the app shows the reason and the event log channels it is waiting on. A quiet device that logs few events can still be fully current.
Missed events
When Windows cannot supply part of an event log, the feed skips past it. SparkLogs shows those spans as Missed events. They are a notice and need no fix on the device or in your setup. The events may still be in the device's own event log. Only Windows event log feeds report missed events.
Gaps on the timeline
The device timeline marks sleep, hibernation, power off, unexpected shutdowns and stretches when the agent was not running. A stretch with no reports and no known reason is marked No reported data.
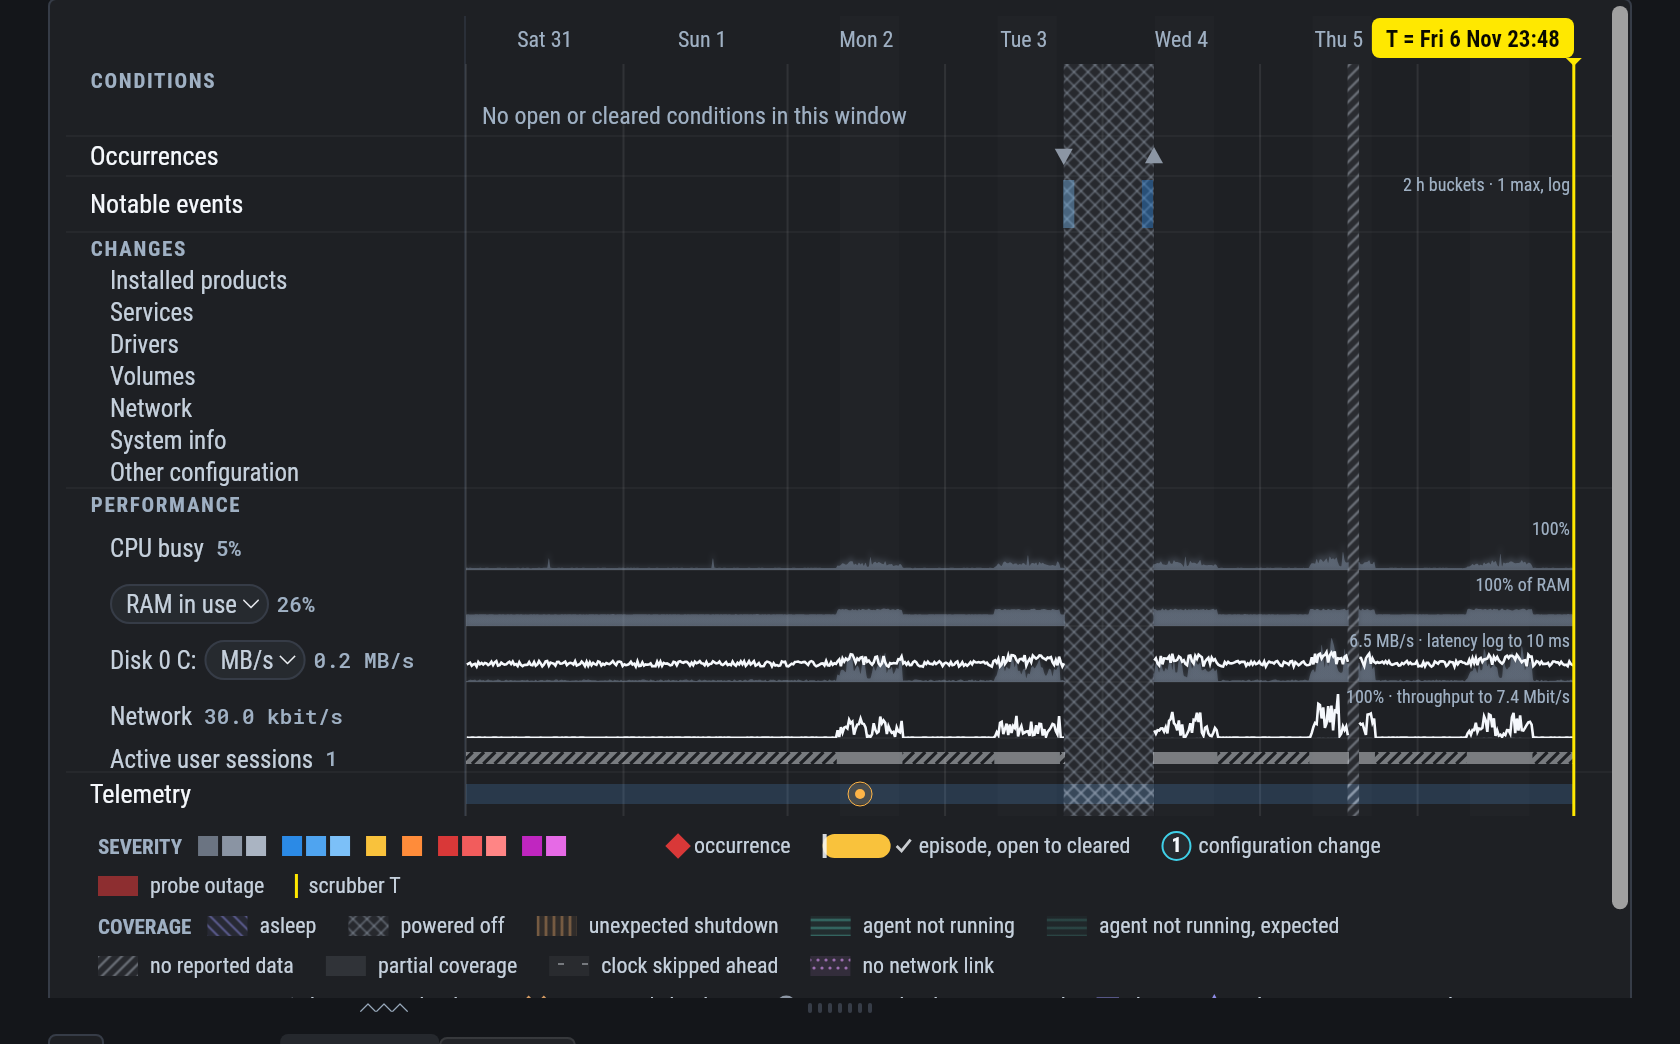
For example:
You:  Nothing in the logs for Tuesday night on ws-044 at Summit Accounting?
AI:   ws-044 reported a shutdown at 18:05 Tuesday and was back at 07:50 Wednesday.
      Every feed is current and no events were missed.
      [ws-044 at 18:05]
Open the link to see the powered-off stretch on the timeline. The ticket note is one line: no data while the device was off.
Where to look
- The device header shows collection status: Collecting, a count of feeds behind or stuck, Collection blocked, Collection degraded or Onboarding.
- The device's Collection tab shows when each feed was not current in the window, plus the agent and Data Feed Pack versions.
- Configure > Agents lists every agent with its connectivity and collection status. Filter by Needs attention, Offline or Inactive. See Manage and verify agents.
- Notices on the Home dashboard about agents that need attention or are offline open that list with the filter applied.
Ingest-key sources
Logs sent with an ingest key have no feed health. Only an agent knows what it is supposed to collect.
Related settings
- The release ring decides which agent version your devices run. A dot on a device's icon means its agent is older than the latest version on its ring. See release rings.
- Network monitoring (Workspace Settings > Policy) sets which network checks run and how connection addresses are recorded. See Device network.
- Ingest (Workspace Settings > Policy) sets the highest severity an event can have when no Data Feed Pack curated it, as with ingest-key logs.
To troubleshoot the agent itself, see Troubleshooting.