Device Timeline
The device timeline shows one device's conditions, crashes, configuration changes, notable events and performance over a window of time, 7 days by default. The SparkLogs Agent on the device reports all of it. Health Topics lists everything it reports about a device's state.
Open it from Fleet, a device link in an AI answer, or Open device at this time on an event in Explore.
The window and T
T is the moment you are inspecting, the vertical line on the timeline. Findings lists the window's conditions and crashes, worst first. Click the timeline or select a finding to move T. A copied link keeps the window, T, tab and selection.
Tabs come in two groups:
- Device State tabs (Overview, Performance, Storage, Network, Processes, Software and others) show the device as reported at or before T.
- Event Explorer tabs (Changes, Conditions, Crashes, Logs and others) list what happened over the whole window.
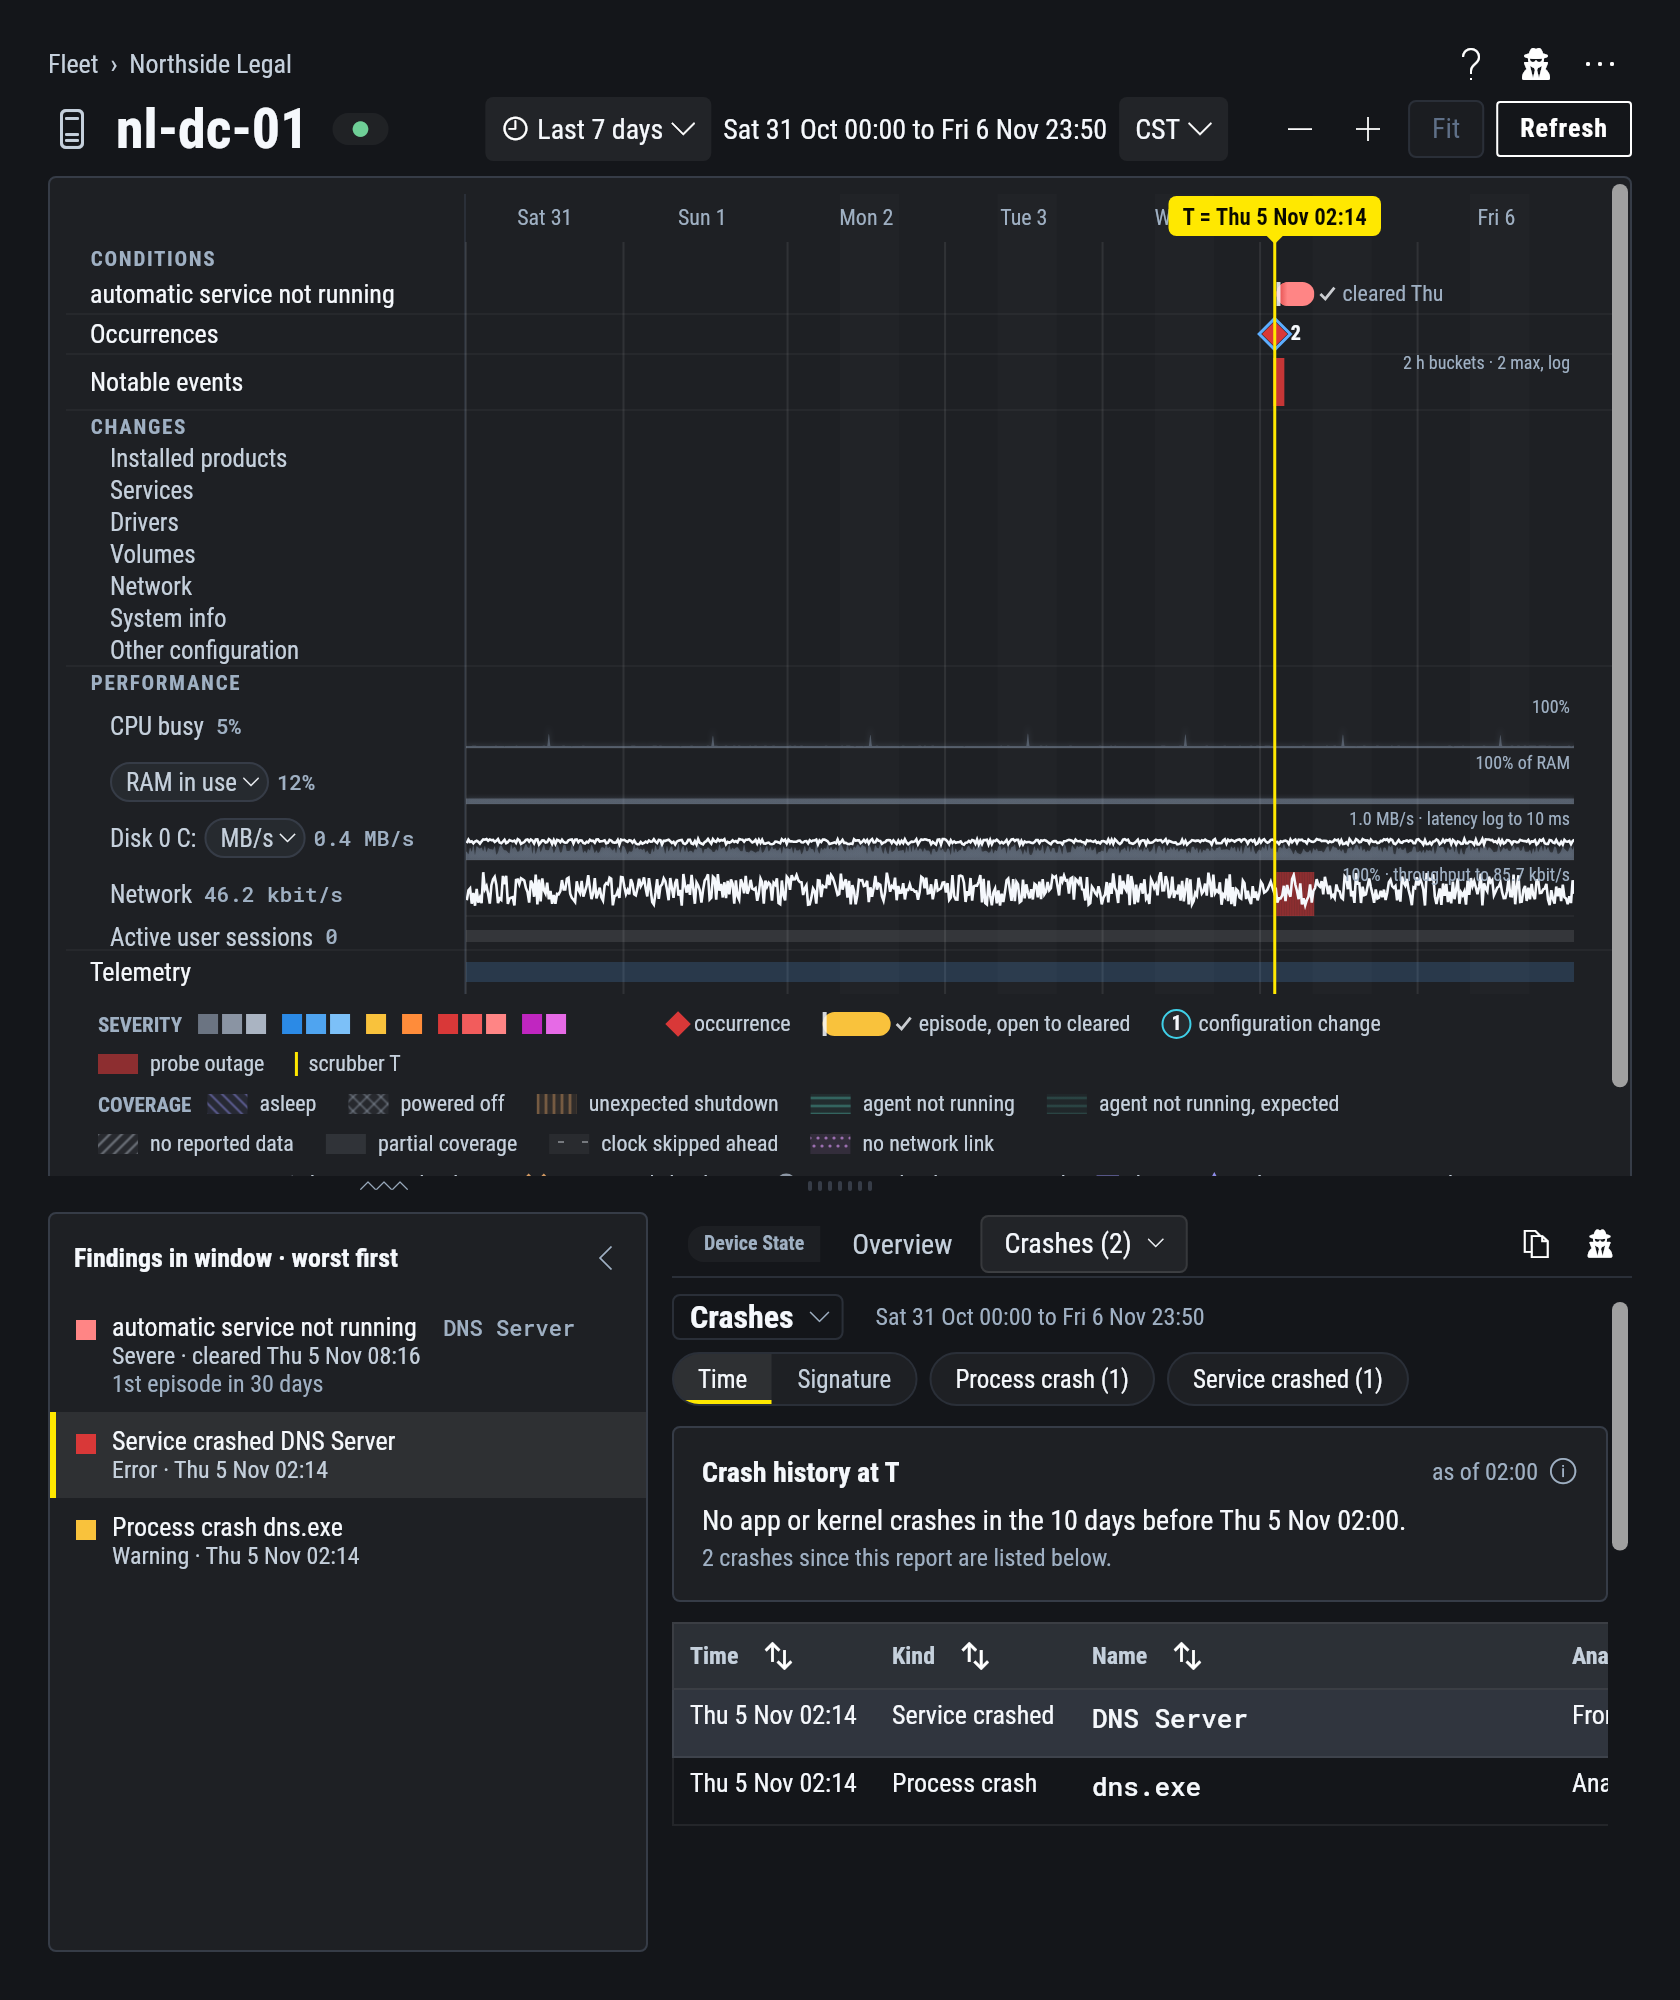
Conditions
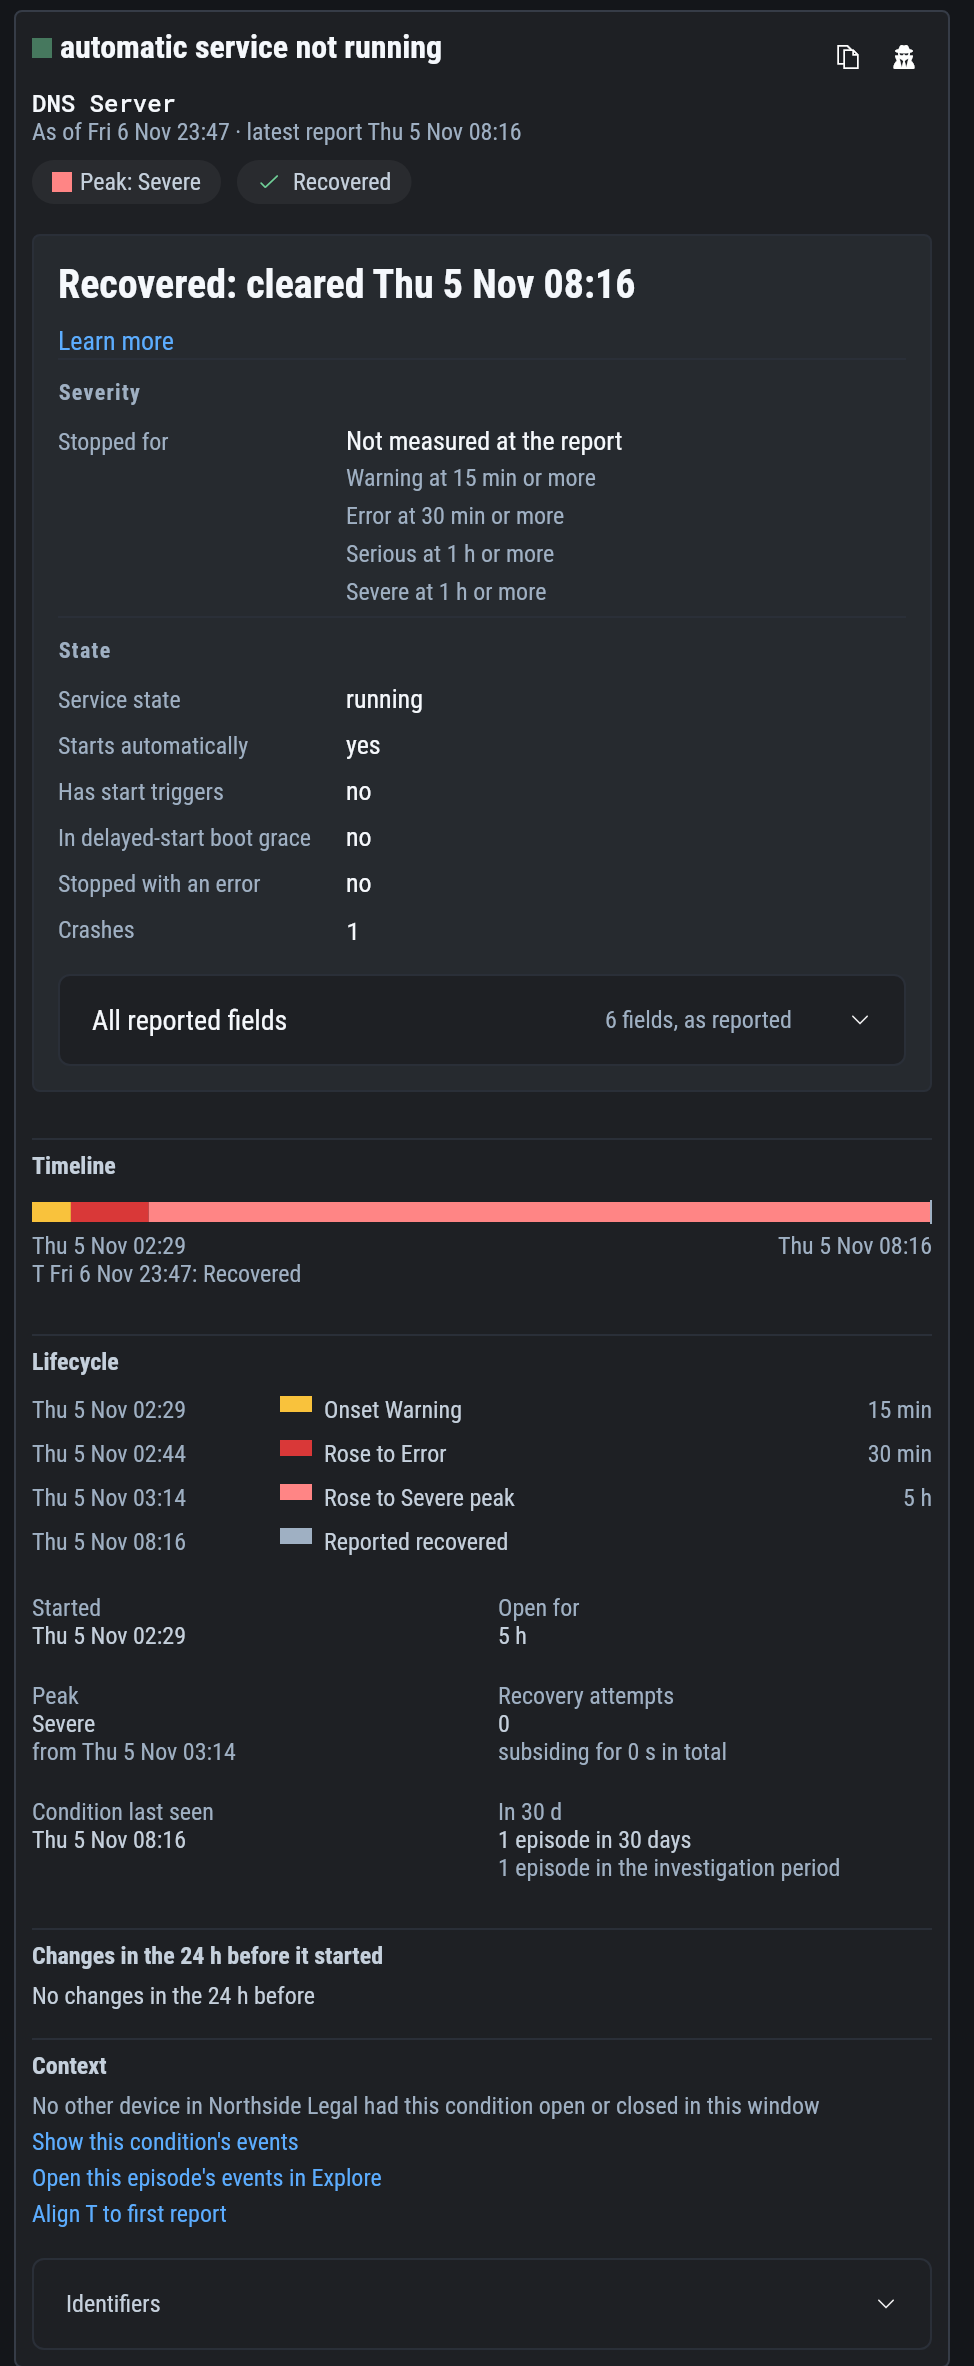
A condition is a problem the agent keeps tracking until it clears, such as a volume filling, a service that should run but is down, or an app that keeps crashing. Its severity can rise or fall while it is open. It closes when the agent sees the problem clear or the check no longer applies.
| An open condition shows | When |
|---|---|
| Subsiding | Its readings are improving. |
| Clearing up | The problem has cleared and the condition is waiting to close. |
| Held again | The problem returned before the condition closed. |
The condition's lifecycle lists each step with its time: Onset at the first severity, Rose to a higher one, and Reported recovered when it clears.
A threshold that depends on how long a problem has lasted counts only the time the device was on, awake and watched by the agent. A laptop asleep over a weekend does not escalate. An open condition at Info or Notice is context and needs no ticket.
A condition also shows how many other devices in the same organization (for most MSPs, a client) had it in the window. To look across clients, see Fleet-wide questions.
Changes and crashes
The Changes tab lists software, driver, service, volume, system and security setting changes with old and new values. Routine maintenance such as updates stays hidden until you turn on the Maintenance chip. A condition lists the changes in the 24 hours before it began. Start there when you look for a cause.
The Crashes tab groups repeats of the same application or kernel crash, with the failure details and dump analysis the device reported. A kernel crash can show its bugcheck. A crash with no dump shows only its event.
When a reading was reported
A Device State card shows the latest report at or before T, with its as of time, which can be hours earlier. Not known at T means the device had not reported on that topic by T.
The timeline also marks gaps in the data, such as power off or the agent not running. See Collection health.
Example: DNS stops on a domain controller
Your RMM alerts that the DNS Server service is stopped on nl-dc-01 at Northside Legal.
You:  nl-dc-01 at Northside Legal: why did DNS stop overnight, and who was affected?
AI:   The DNS Server process on nl-dc-01 crashed at 02:14 and the service stayed stopped.
      The condition reached Severe at 03:14. From the start of the workday,
      nl-lt-07 and laptop-031 got no answer to name lookups.
      [nl-dc-01, DNS service condition]  [System log crash event]  [nl-lt-07]  [laptop-031]
The nl-dc-01 link opens on the condition.
Select the crash in Findings to set T to 02:14.
Check the changes in the 24 hours before the condition began for anything installed or reconfigured first.
On the Crashes tab, select the crash and copy the investigation prompt.
Ask the AI for a cited investigation report to attach to the ticket.