Conditions
A condition is a problem the agent keeps tracking until it clears, such as a volume filling, a service that should run but is down, or an app that keeps crashing. Its severity can rise or fall while it is open. It closes when the agent sees the problem clear or the check no longer applies.
The Conditions tab of the device timeline lists every condition that was open or cleared in the window. Device Health Conditions lists every condition the agent can report.
The list
Conditions that are open at T come first, worst first. Each condition shows its name, the item it is about (a volume, a service, a program), how many times it opened in the window and in the last 30 days, and how many other devices have it open. Under it is one row per time it opened.
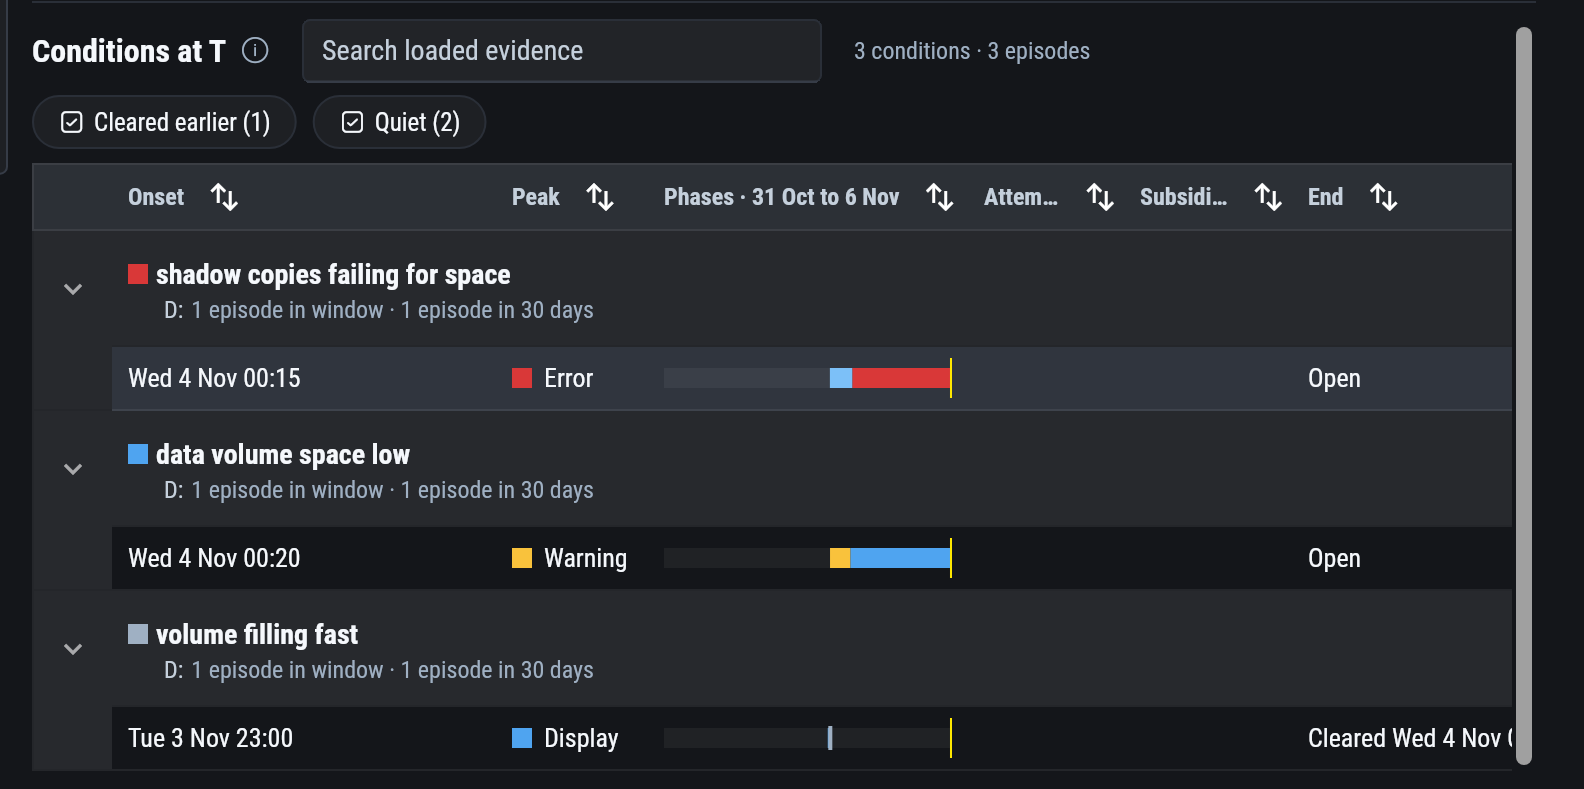
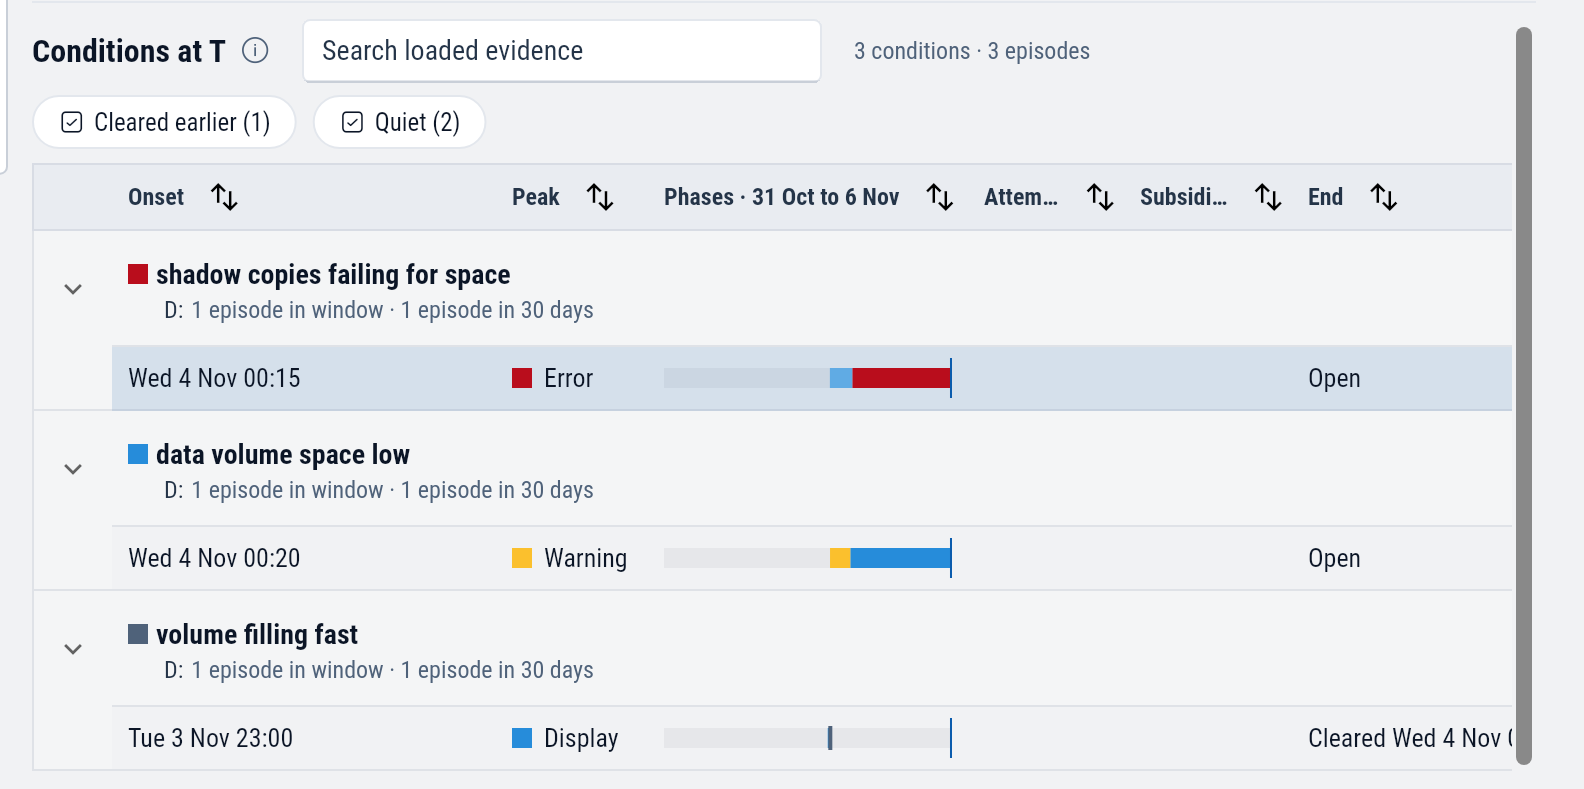
| Column | Shows |
|---|---|
| Onset | When it began. first observed means the agent was not watching at the start, so it may have begun earlier. |
| Peak | The highest severity it reached. |
| Phases | Its severity across the window as a colored strip, hatched where the device was not reporting. |
| Attempts | How many times it started to recover and then returned. |
| Subsiding | The total time its readings were improving. |
| End | Open, or when it cleared. |
| Duration | How long it lasted. |
Two chips filter the list. Cleared earlier shows conditions that closed before T. Quiet shows conditions that stayed at Display severity or lower. A quiet condition is context and needs no ticket.
A condition's severity uses the same levels as events. Display and Notice are the low end, and Warning, Minor, Error, Serious, Severe and Critical rise from there.
An open condition shows its state at T with its severity, such as "Held again Warning":
| State | When |
|---|---|
| Subsiding | Its readings are improving. |
| Clearing up | The problem has cleared and the condition is waiting to close. |
| Held again | The problem returned before the condition closed. |
Why it is at this severity
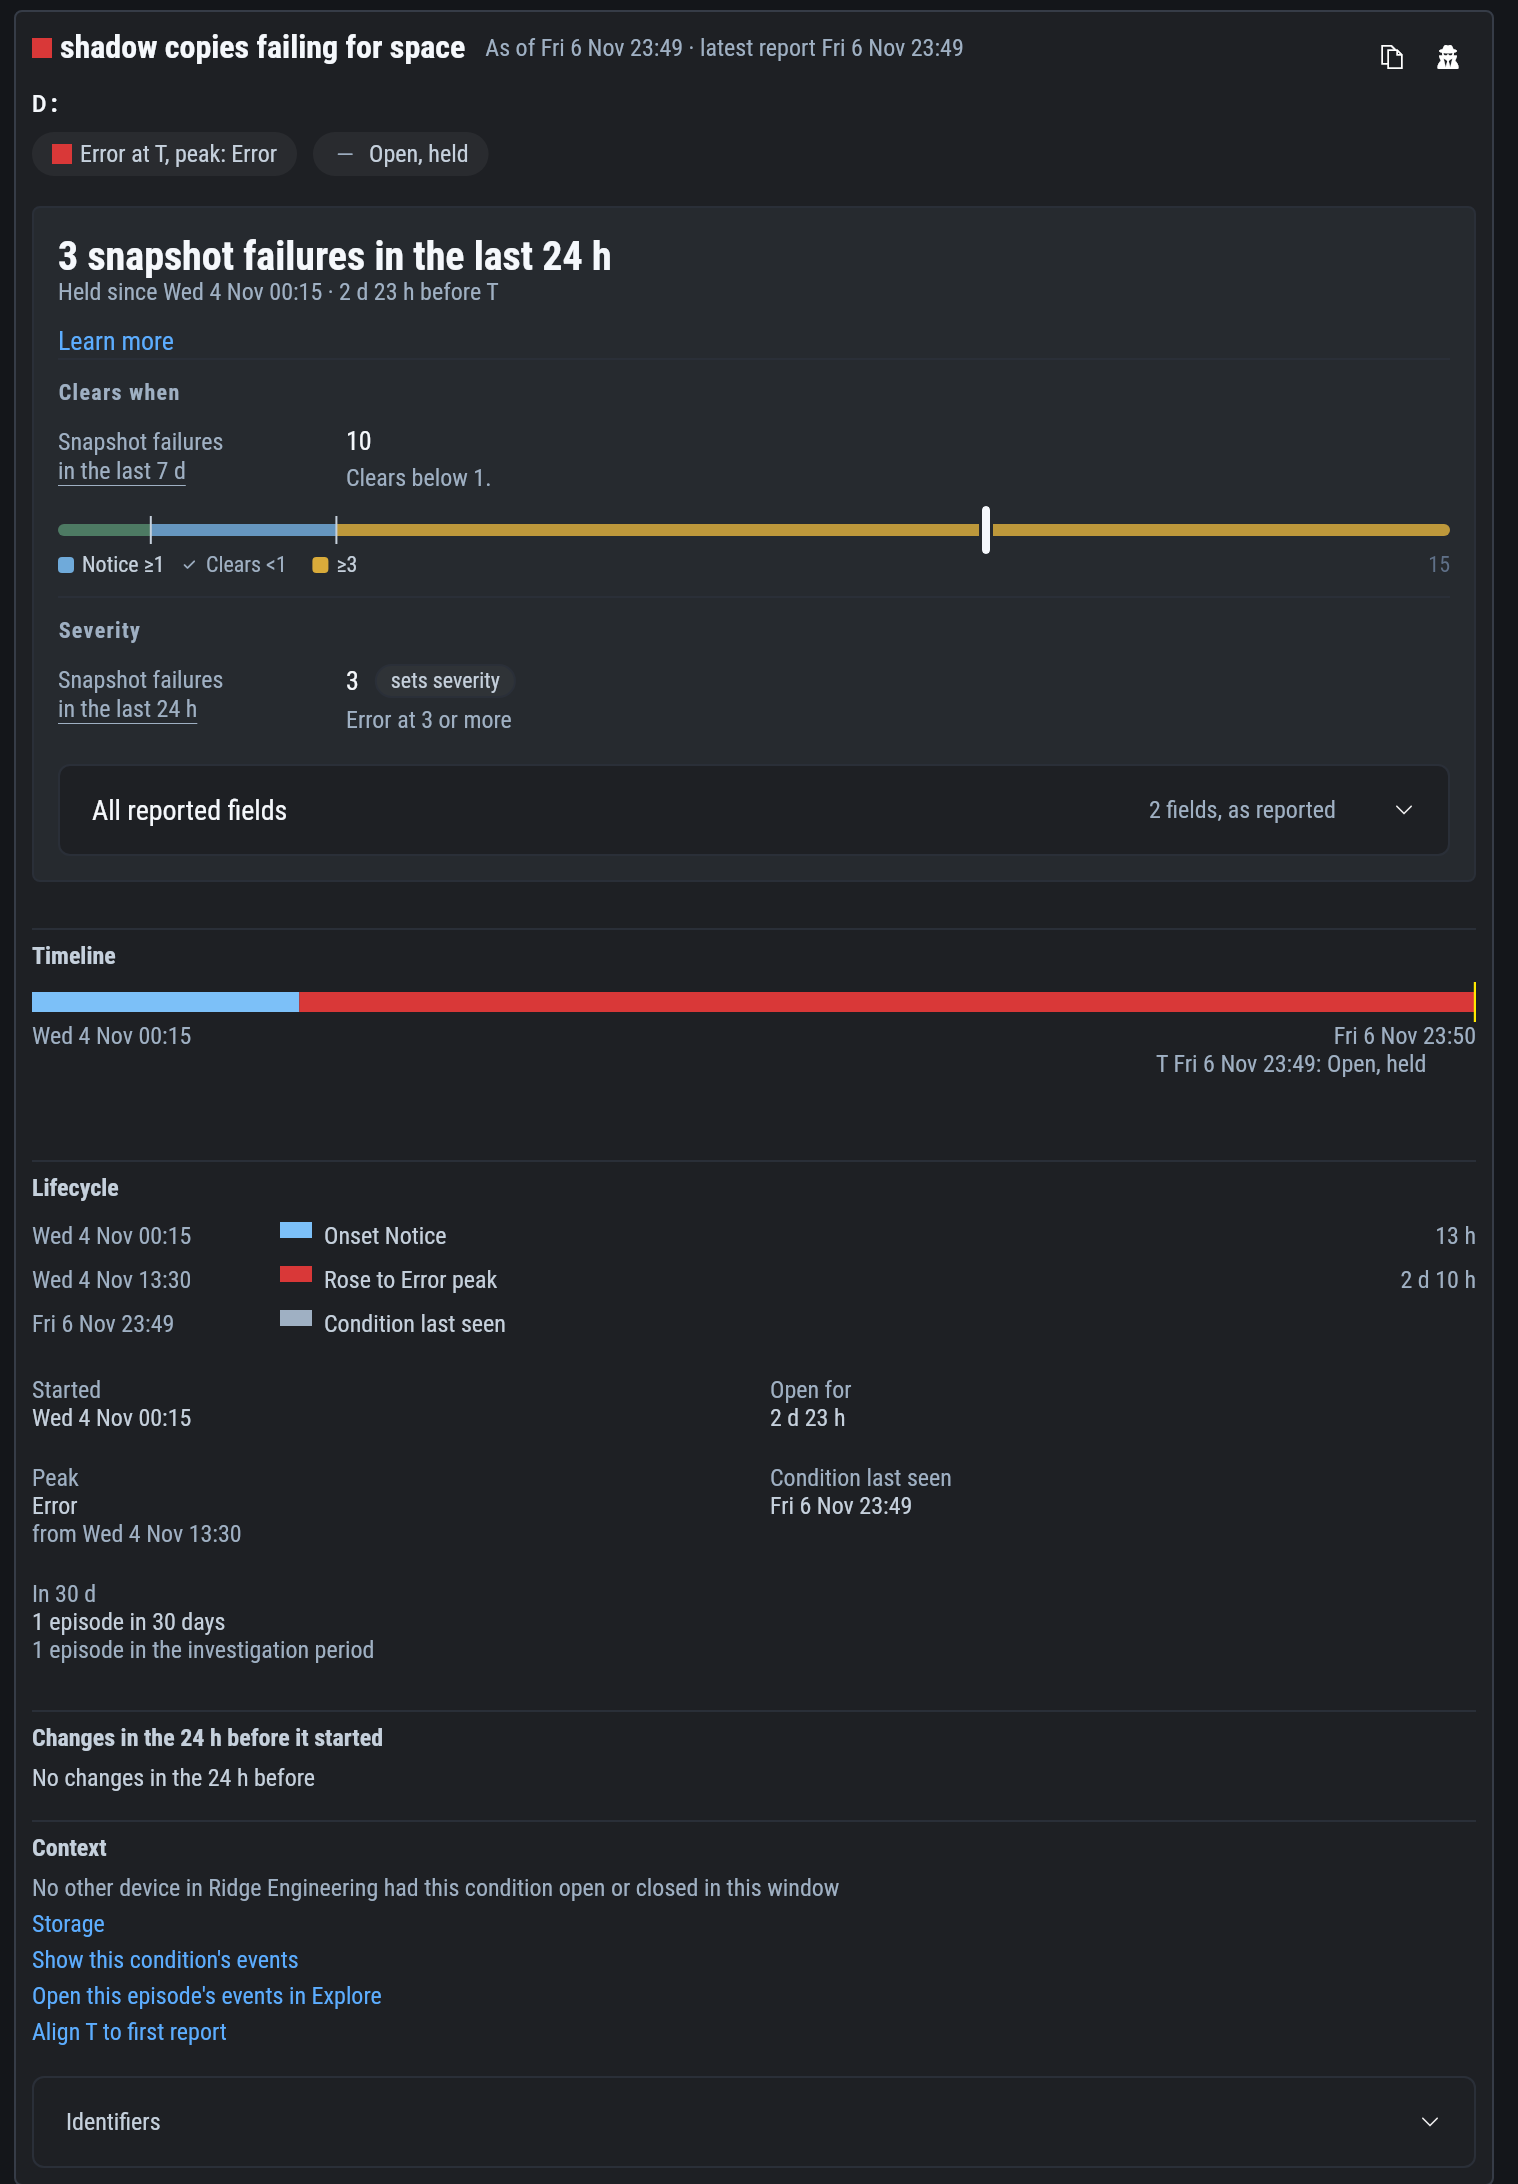
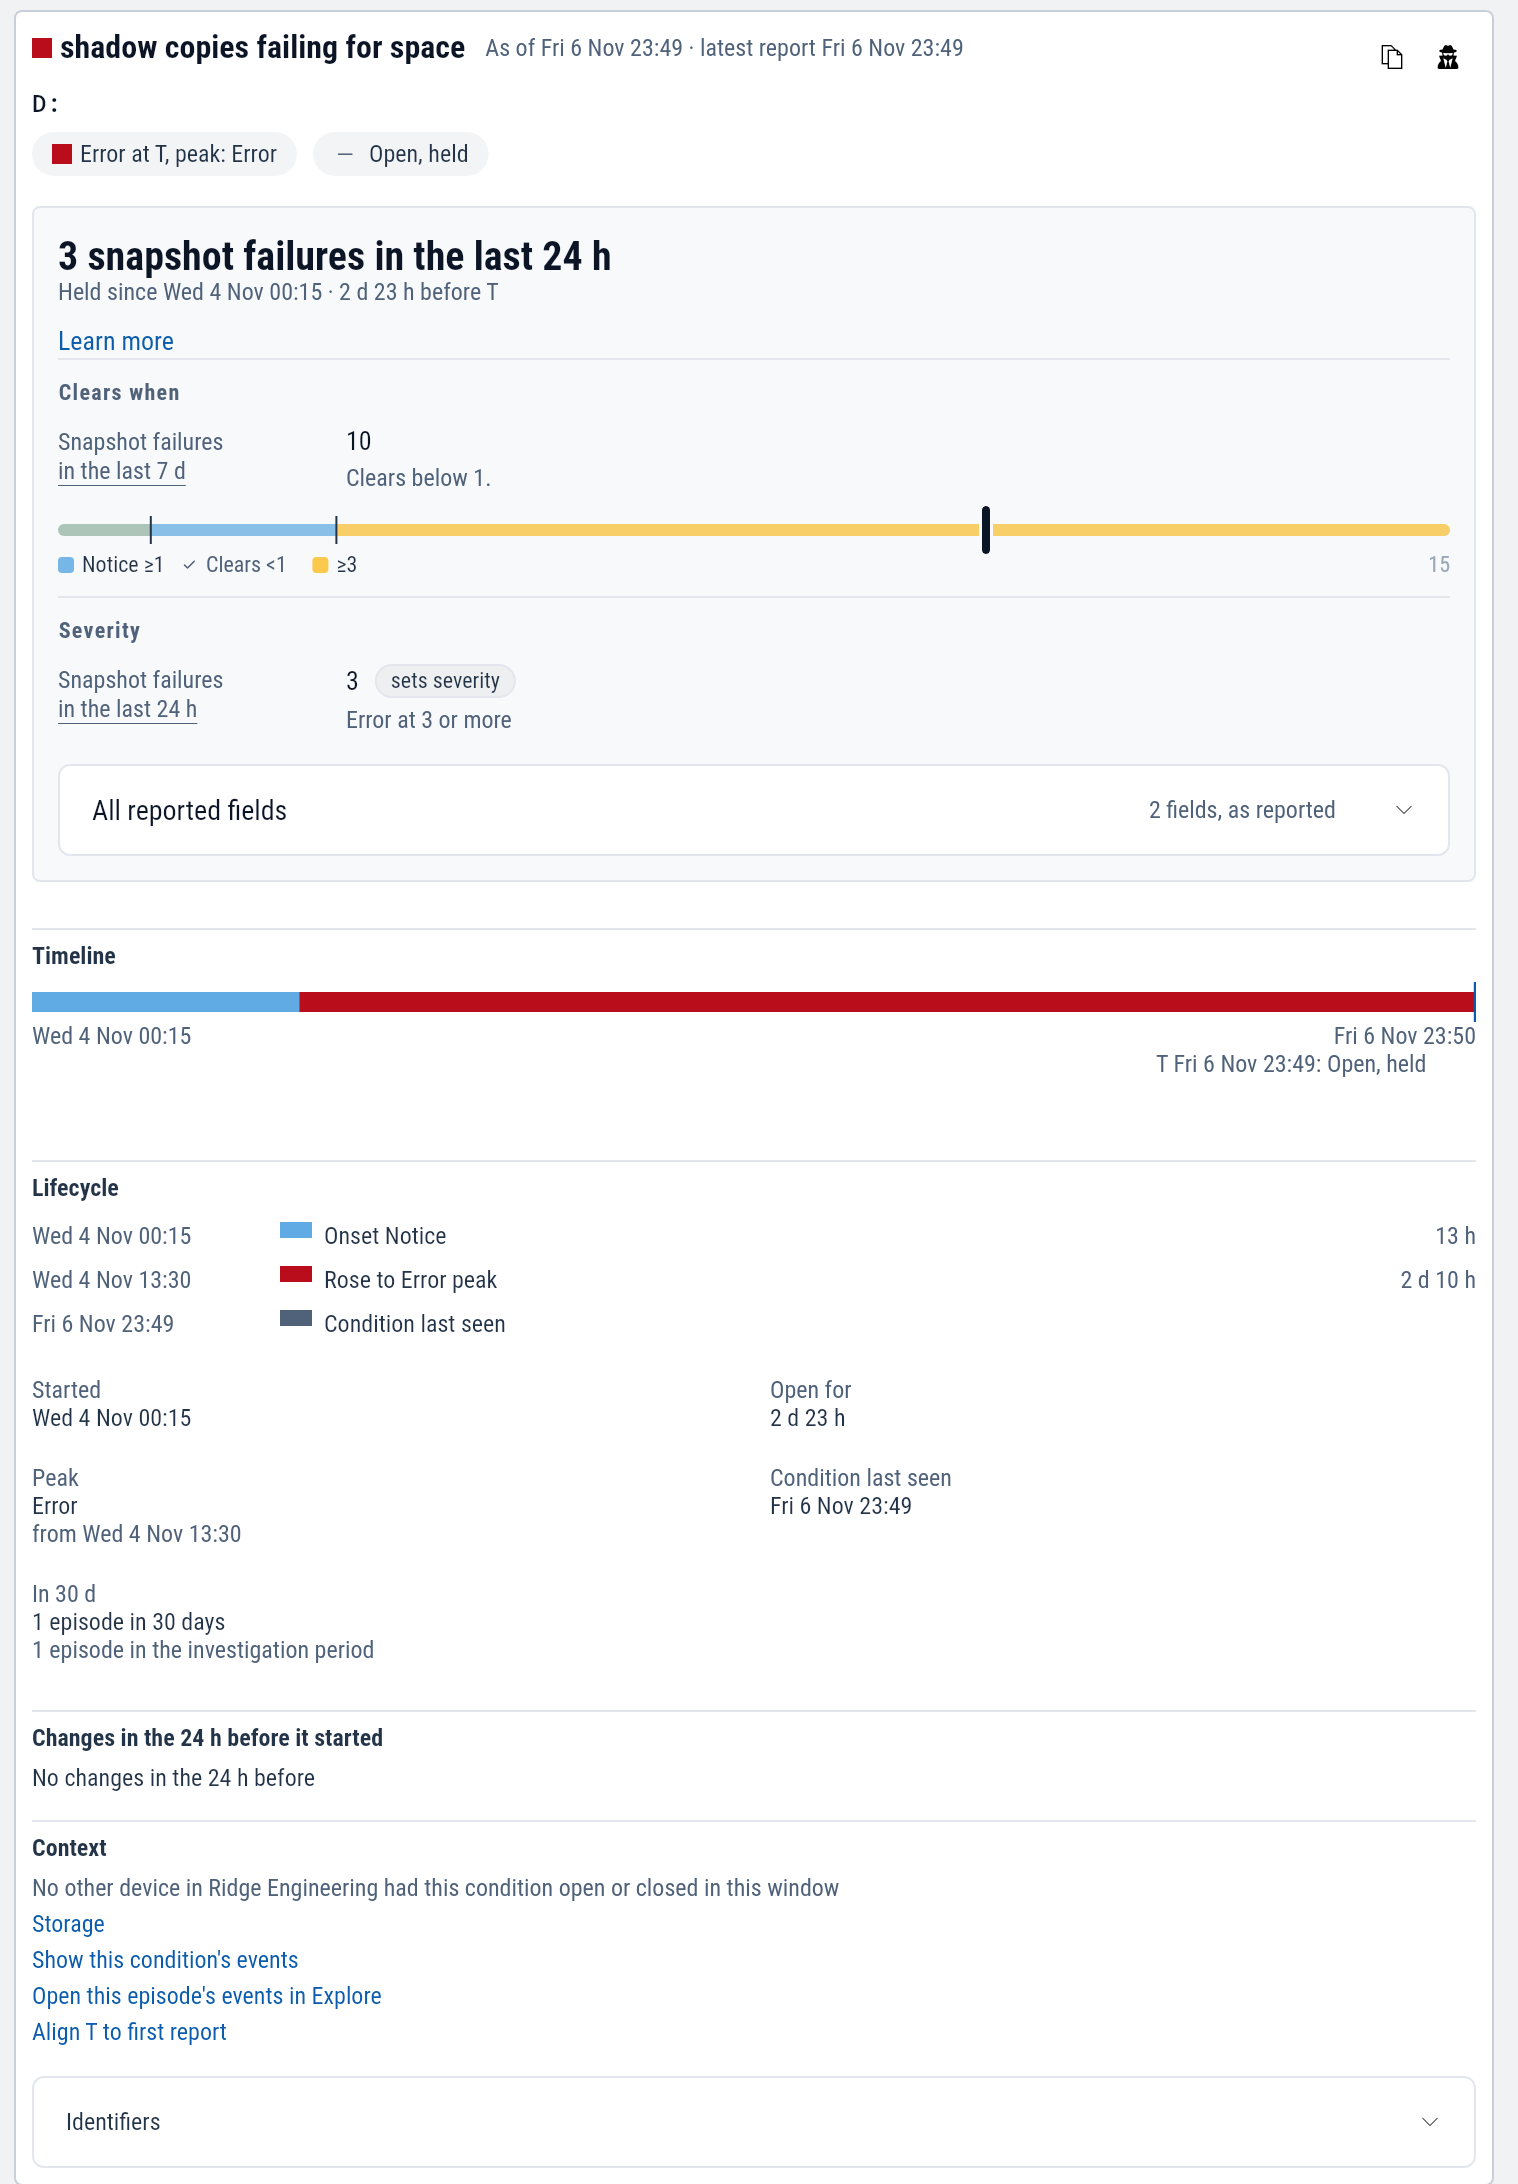
Select a row for the condition's details. The headline is the reading that set the severity, such as "3 snapshot failures in the last 24 h" or a volume's free space. Learn more opens the condition's reference page, with what it means and what to check.
Under the headline, a scale shows where the reading sits:
- Clears when shows the reading that has to recover, the line it has to cross, and where it is now.
- Severity shows the reading that set the current severity and the value at which each severity begins.
- When a severity depends on how long a problem has lasted, a progress line shows how much longer until it rises, steps down or clears.
A threshold that depends on how long a problem has lasted counts only the time the device was on, awake and watched by the agent. A laptop asleep over a weekend does not escalate. The app calls this awake-time.
How it developed
Timeline draws the condition from its first report to its clear, colored by severity. Lifecycle lists each step with its time and severity: Onset at the first severity, Rose to with the higher one, such as "Rose to Error peak", and Reported recovered when it clears. Select a step to move T there.
A stretch when the device was asleep, off or not reporting appears in the lifecycle too. When a condition cleared during one, the app shows the last time it was seen open and says it may already have ended at T.
What changed before it started
Changes in the 24 h before it started lists the configuration changes recorded on the device in the day before the onset. Start here when you look for a cause. All changes in the 24 h before opens them on the Changes tab.
The same condition on other devices
Context shows how many other devices in the same organization had the condition in the window. For most MSPs an organization is a client. Select the count for the list of devices, and select a device to open its timeline on the same condition.
The count uses each device's latest report in the window, which can be later than T. To look across clients, see Fleet-wide questions.
Context also links to the condition's events in Explore, and to the tab that holds the item, such as Storage for a volume.
Example: shadow copies failing on a file server
A user at Ridge Engineering cannot restore last night's version of a drawing from re-fs-01.
Open re-fs-01.
Findings shows shadow copies failing for space on volume D: at Error.
Select it.
The headline reads "3 snapshot failures in the last 24 h". Clears when shows 10 failures in the last 7 days, and the condition clears when that count falls below 1. Lifecycle shows it began at Notice at 00:15 on Wednesday and rose to Error at 13:30.
The list shows two more conditions on the same volume. data volume space low opened five minutes after it, and volume filling fast opened the evening before, at 23:00. The three fit one sequence: the volume filled on Tuesday night, and shadow copies began failing for space about an hour later.
Select the volume's row on the Storage tab for its free space and shadow copy storage. To find what filled it, select volume filling fast to move T to its onset, then rank the Processes tab by I/O.