Processes
The Processes tab of the device timeline lists the processes that were running on the device at T. Each reading is that process's average over the hour before the report. For a process's use over time, hover the charts on the Performance tab.
The list
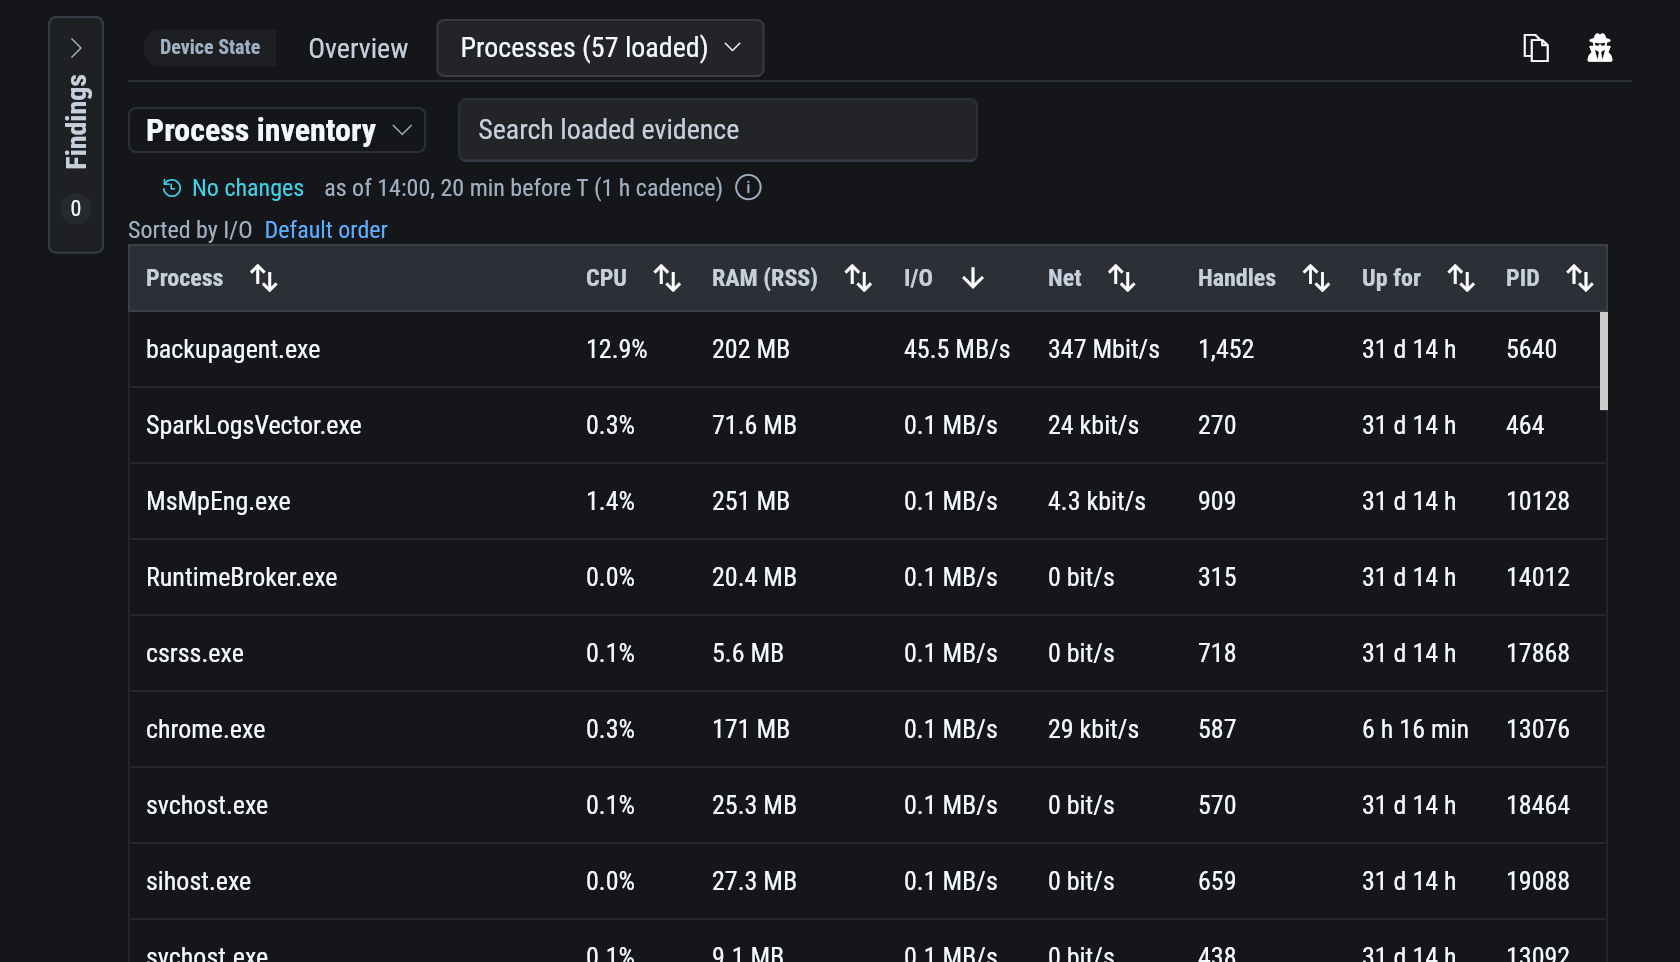
| Column | Shows |
|---|---|
| CPU | Share of all cores. |
| RAM (RSS) | Memory the process holds in RAM, shared pages included. |
| I/O | Read plus write, counting files, pipes, devices and the network. |
| Net | TCP received plus sent. |
| Handles | Open handles. |
| Up for | Time since the process started. |
The list opens sorted by activity, a blend of CPU, I/O and memory use. Select a column heading to sort by it.
Chips filter the list to processes that are New in the window, Changed, or have a condition open at T.
The title switches between two lists. Process inventory is every process the agent reported. Loaded process samples lists the processes the agent ranked busiest in its latest report, and whether CPU, memory or I/O put each one there.
One process
Select a row for the process's details.
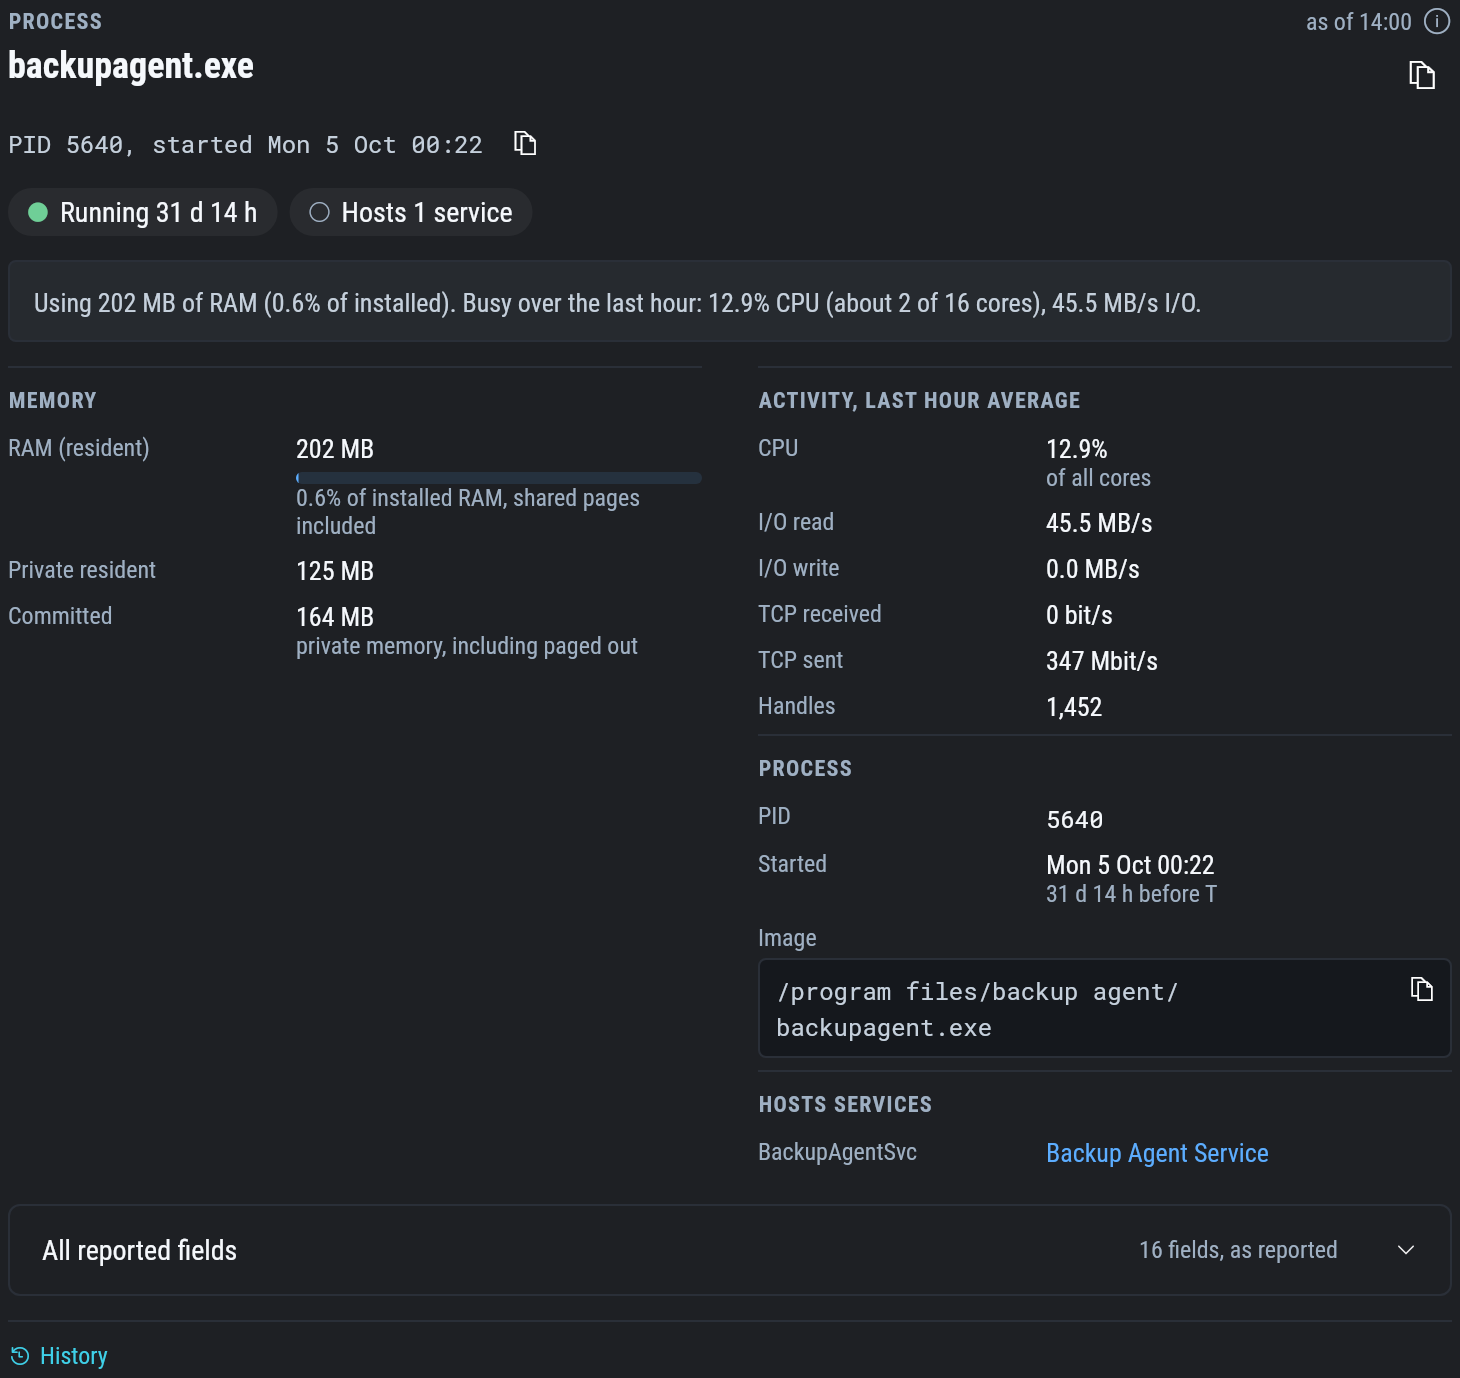
The summary line says how busy the process was over the last hour. Below it are its memory (resident, private and committed), its CPU, I/O and TCP rates, when it started, its image path, and the services it hosts, each linked to its row on the Services tab. History lists the changes recorded for the process.
A process with a condition open, such as a handle count that keeps climbing, shows the condition here.
Example: what filled the volume overnight
On re-fs-01 at Ridge Engineering, volume D: filled on Tuesday night.
Select the volume filling fast condition to move T to 23:00 on Tuesday, then open the Processes tab and sort by I/O.
Robocopy.exe is at the top at 51.1 MB/s, and its Up for reads 1 h.
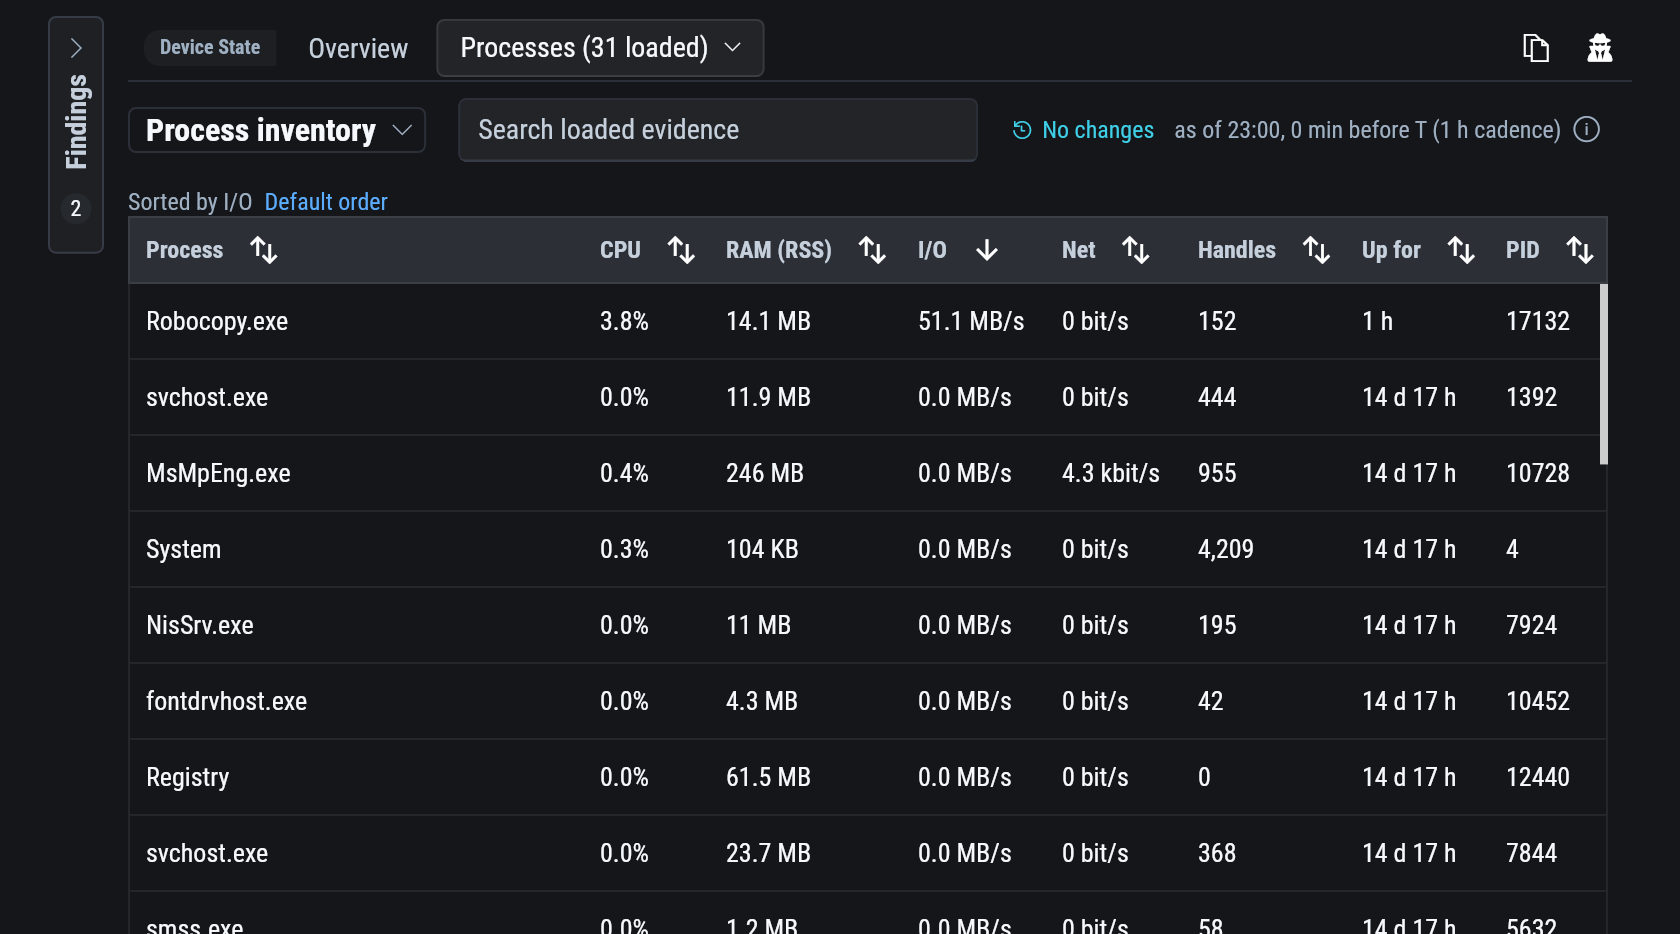
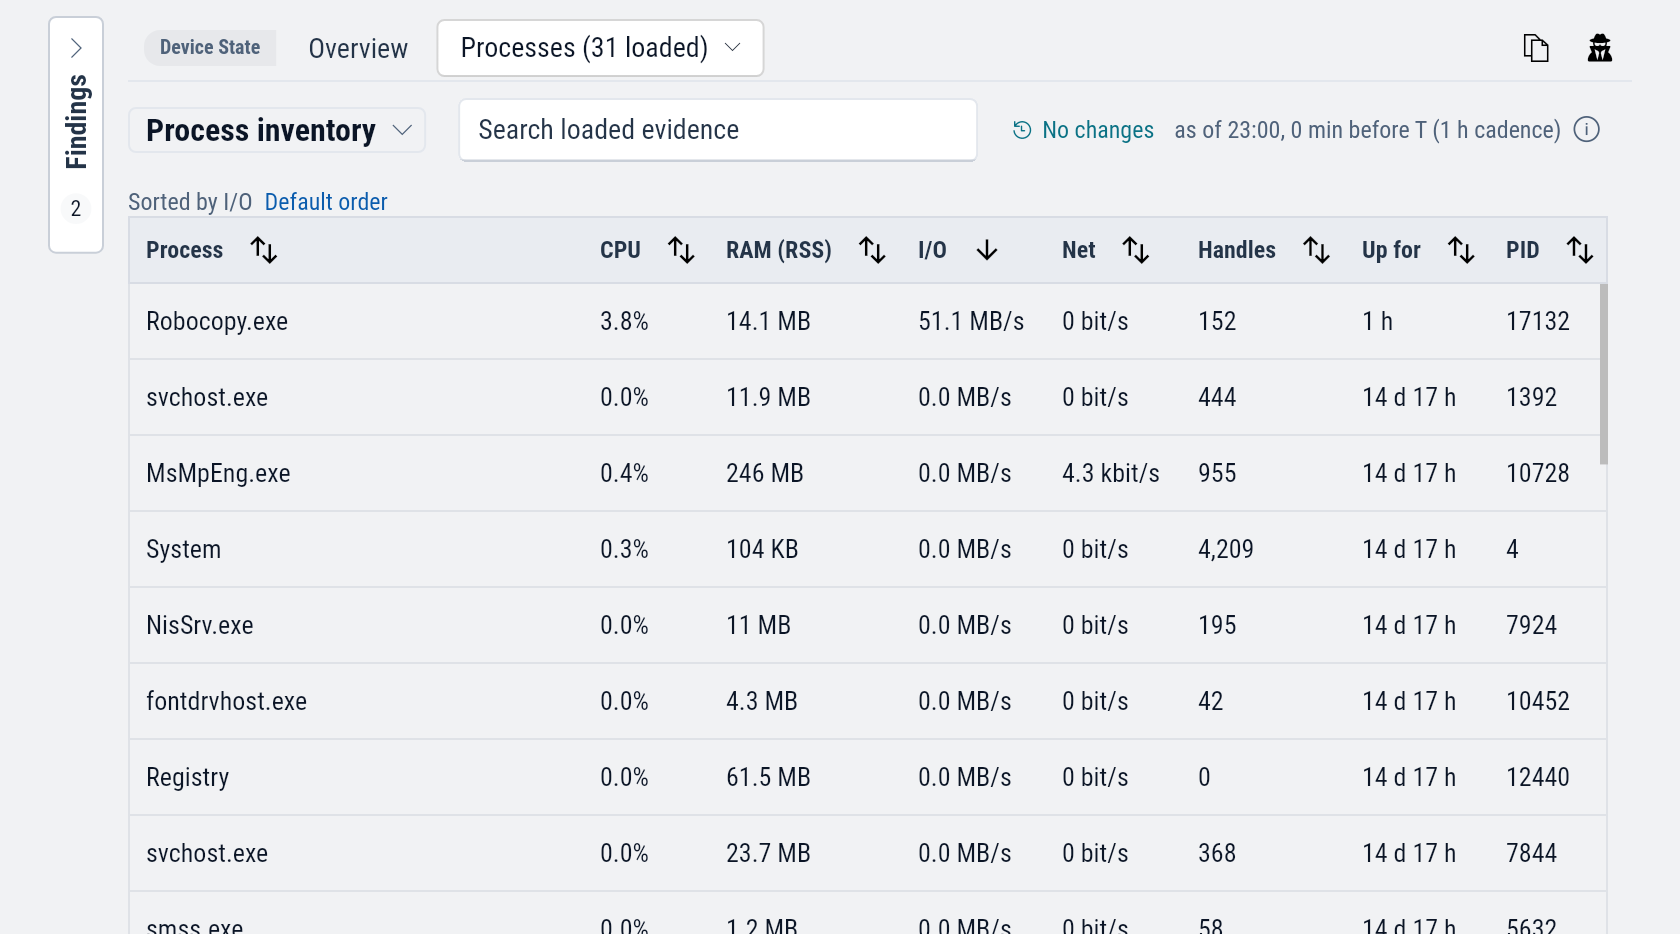
A copy job that began at about 22:00 filled the volume. Select the row for the job's image path and exact start time.