Logs, PowerShell and Signals
Three tabs of the device timeline show the recorded events behind a finding: Logs, PowerShell Activity and Signals. The Logs and PowerShell Activity tabs appear only for people whose role allows them to read events. See Users, Roles and Groups.
Logs
The Logs tab is the Explore event list, limited to this device and centered on T.
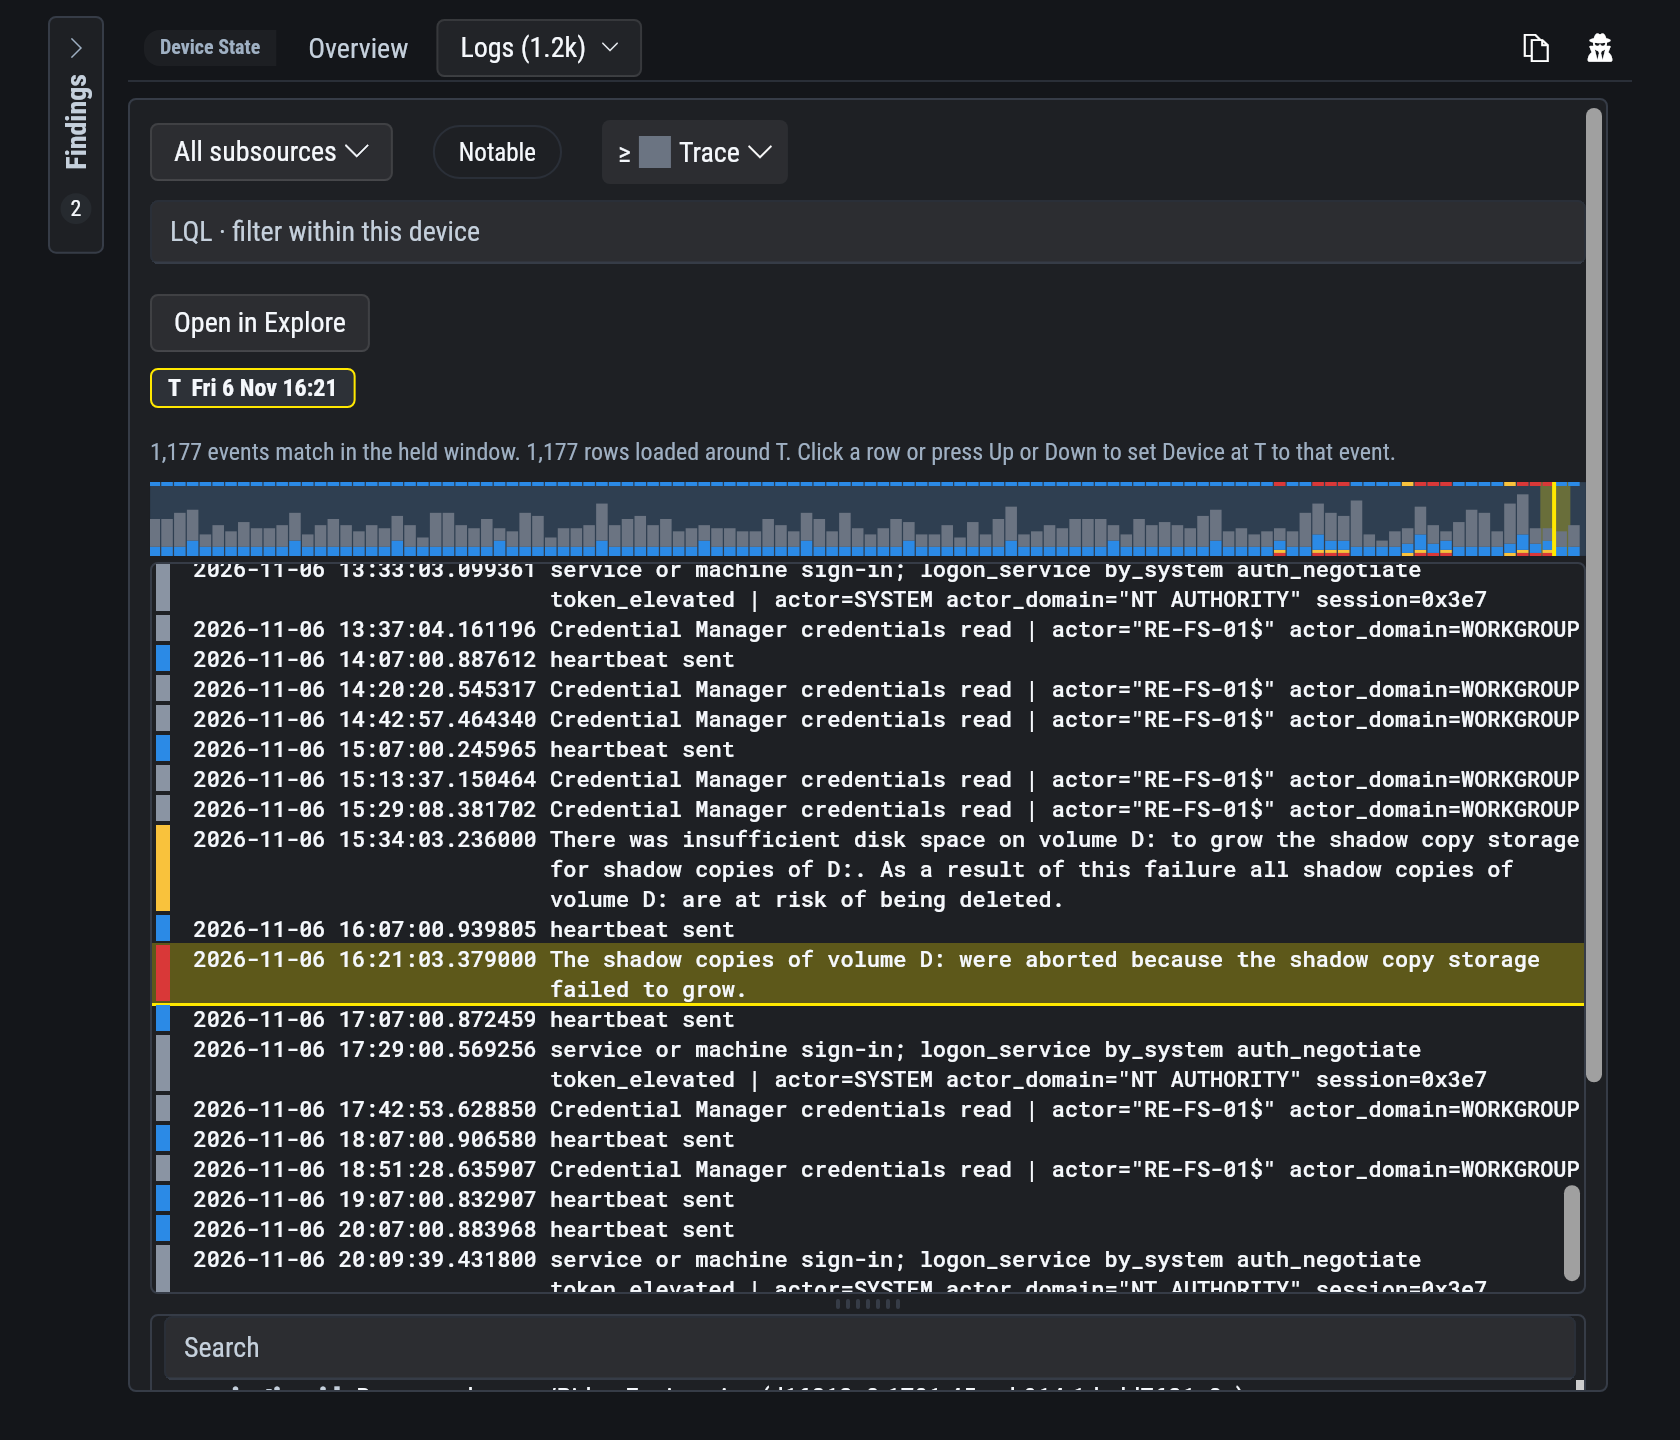
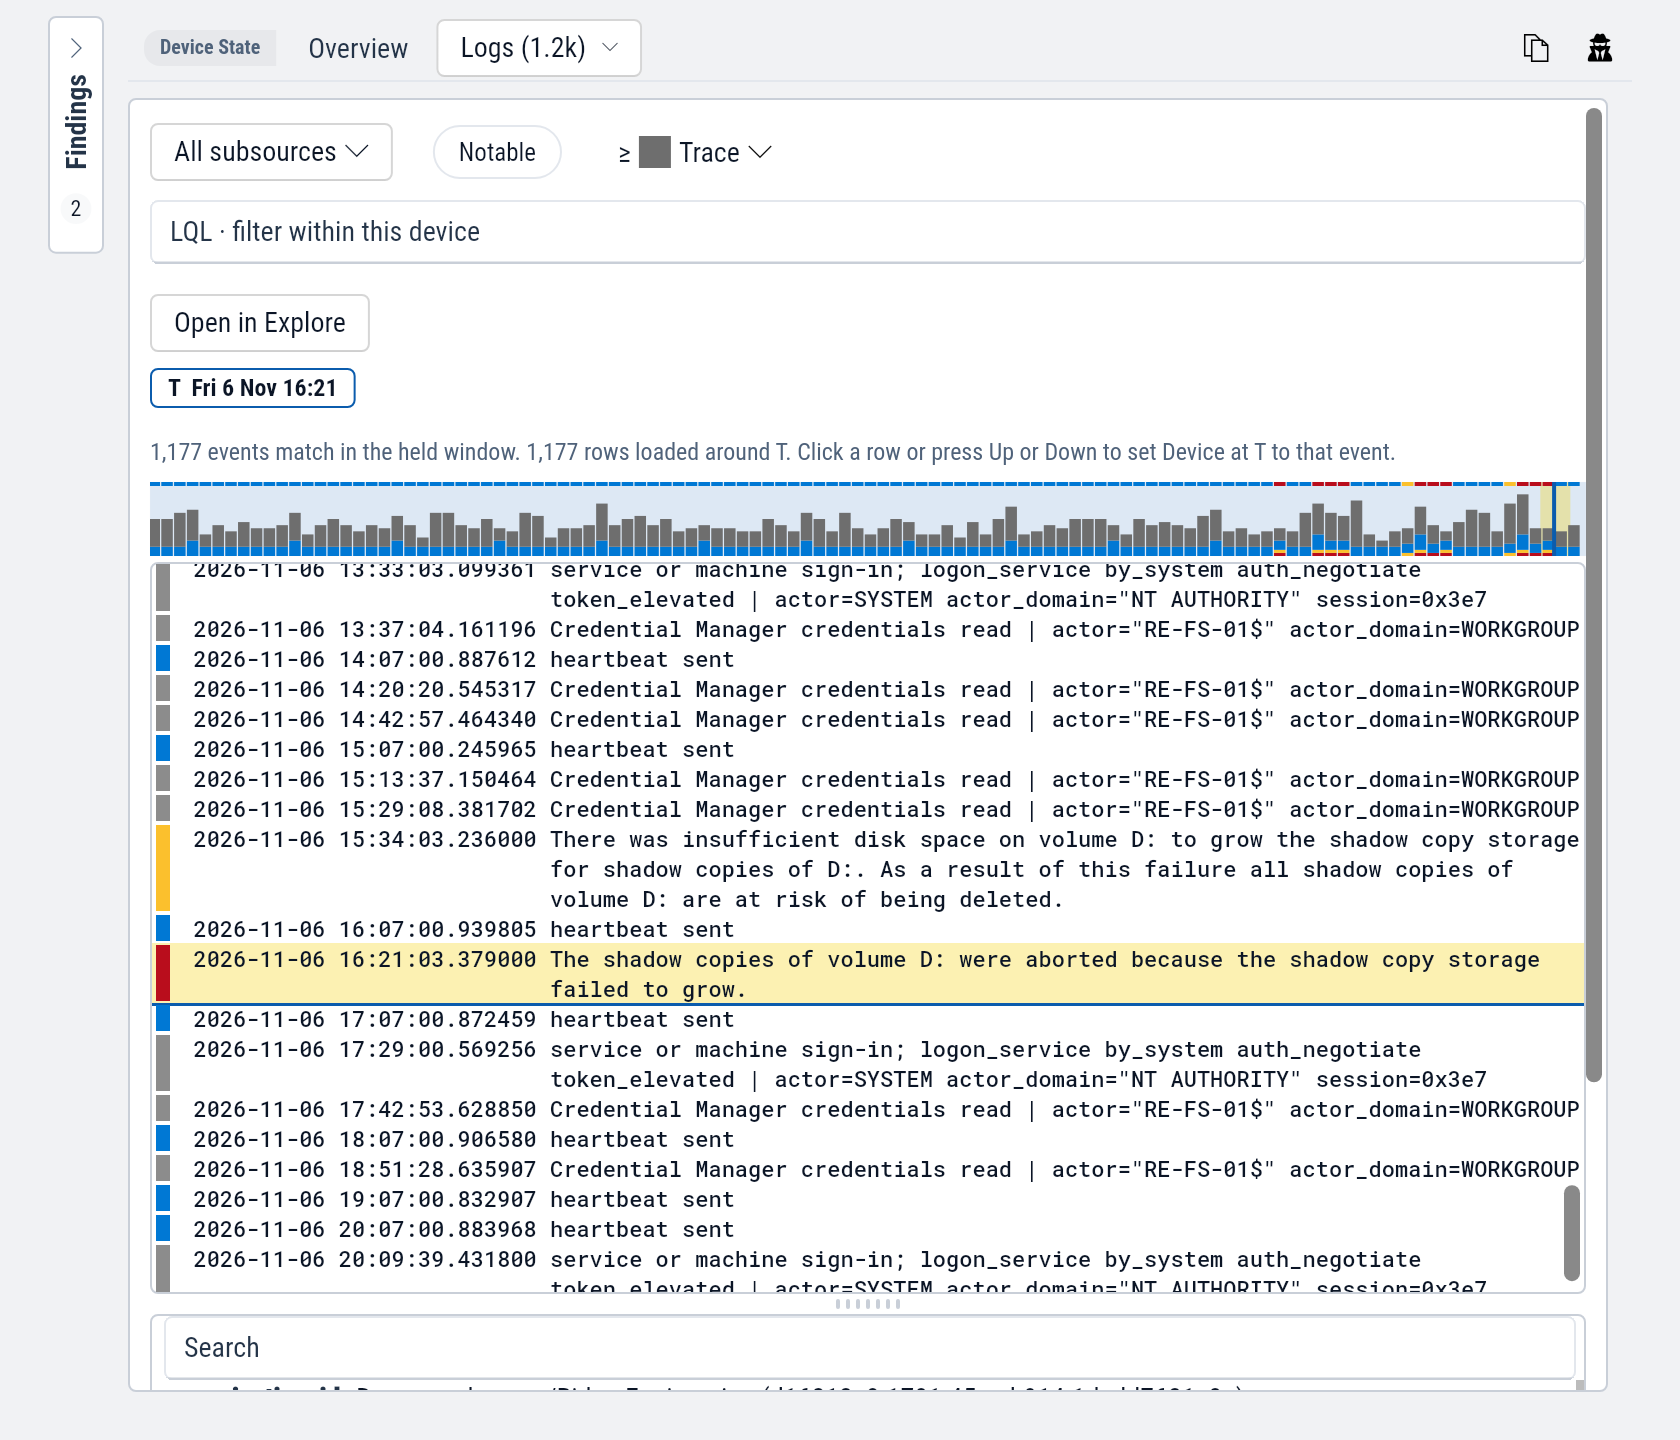
| Control | Does |
|---|---|
| The subsource list | Limits the list to chosen subsources. A subsource is one stream of events on the device, such as a Windows event log channel. |
| Notable | Shows only the events SparkLogs graded as notable. |
| The severity list | Sets the lowest severity shown. |
| The LQL box | Filters within this device, in LQL, the SparkLogs query language. |
| Open in Explore | Opens the same events in Explore, with the same filters and time. |
The chart above the list counts matching events over the window by severity. Click it to move T. Select an event to move T to it, so the Device State tabs show the machine at that instant.
The device's own state reports are left out of the list unless you choose them in the subsource list.
PowerShell Activity
PowerShell Activity lists what PowerShell recorded on the device: script blocks, pipeline executions, errors and engine starts. What appears depends on the device's PowerShell logging policy.
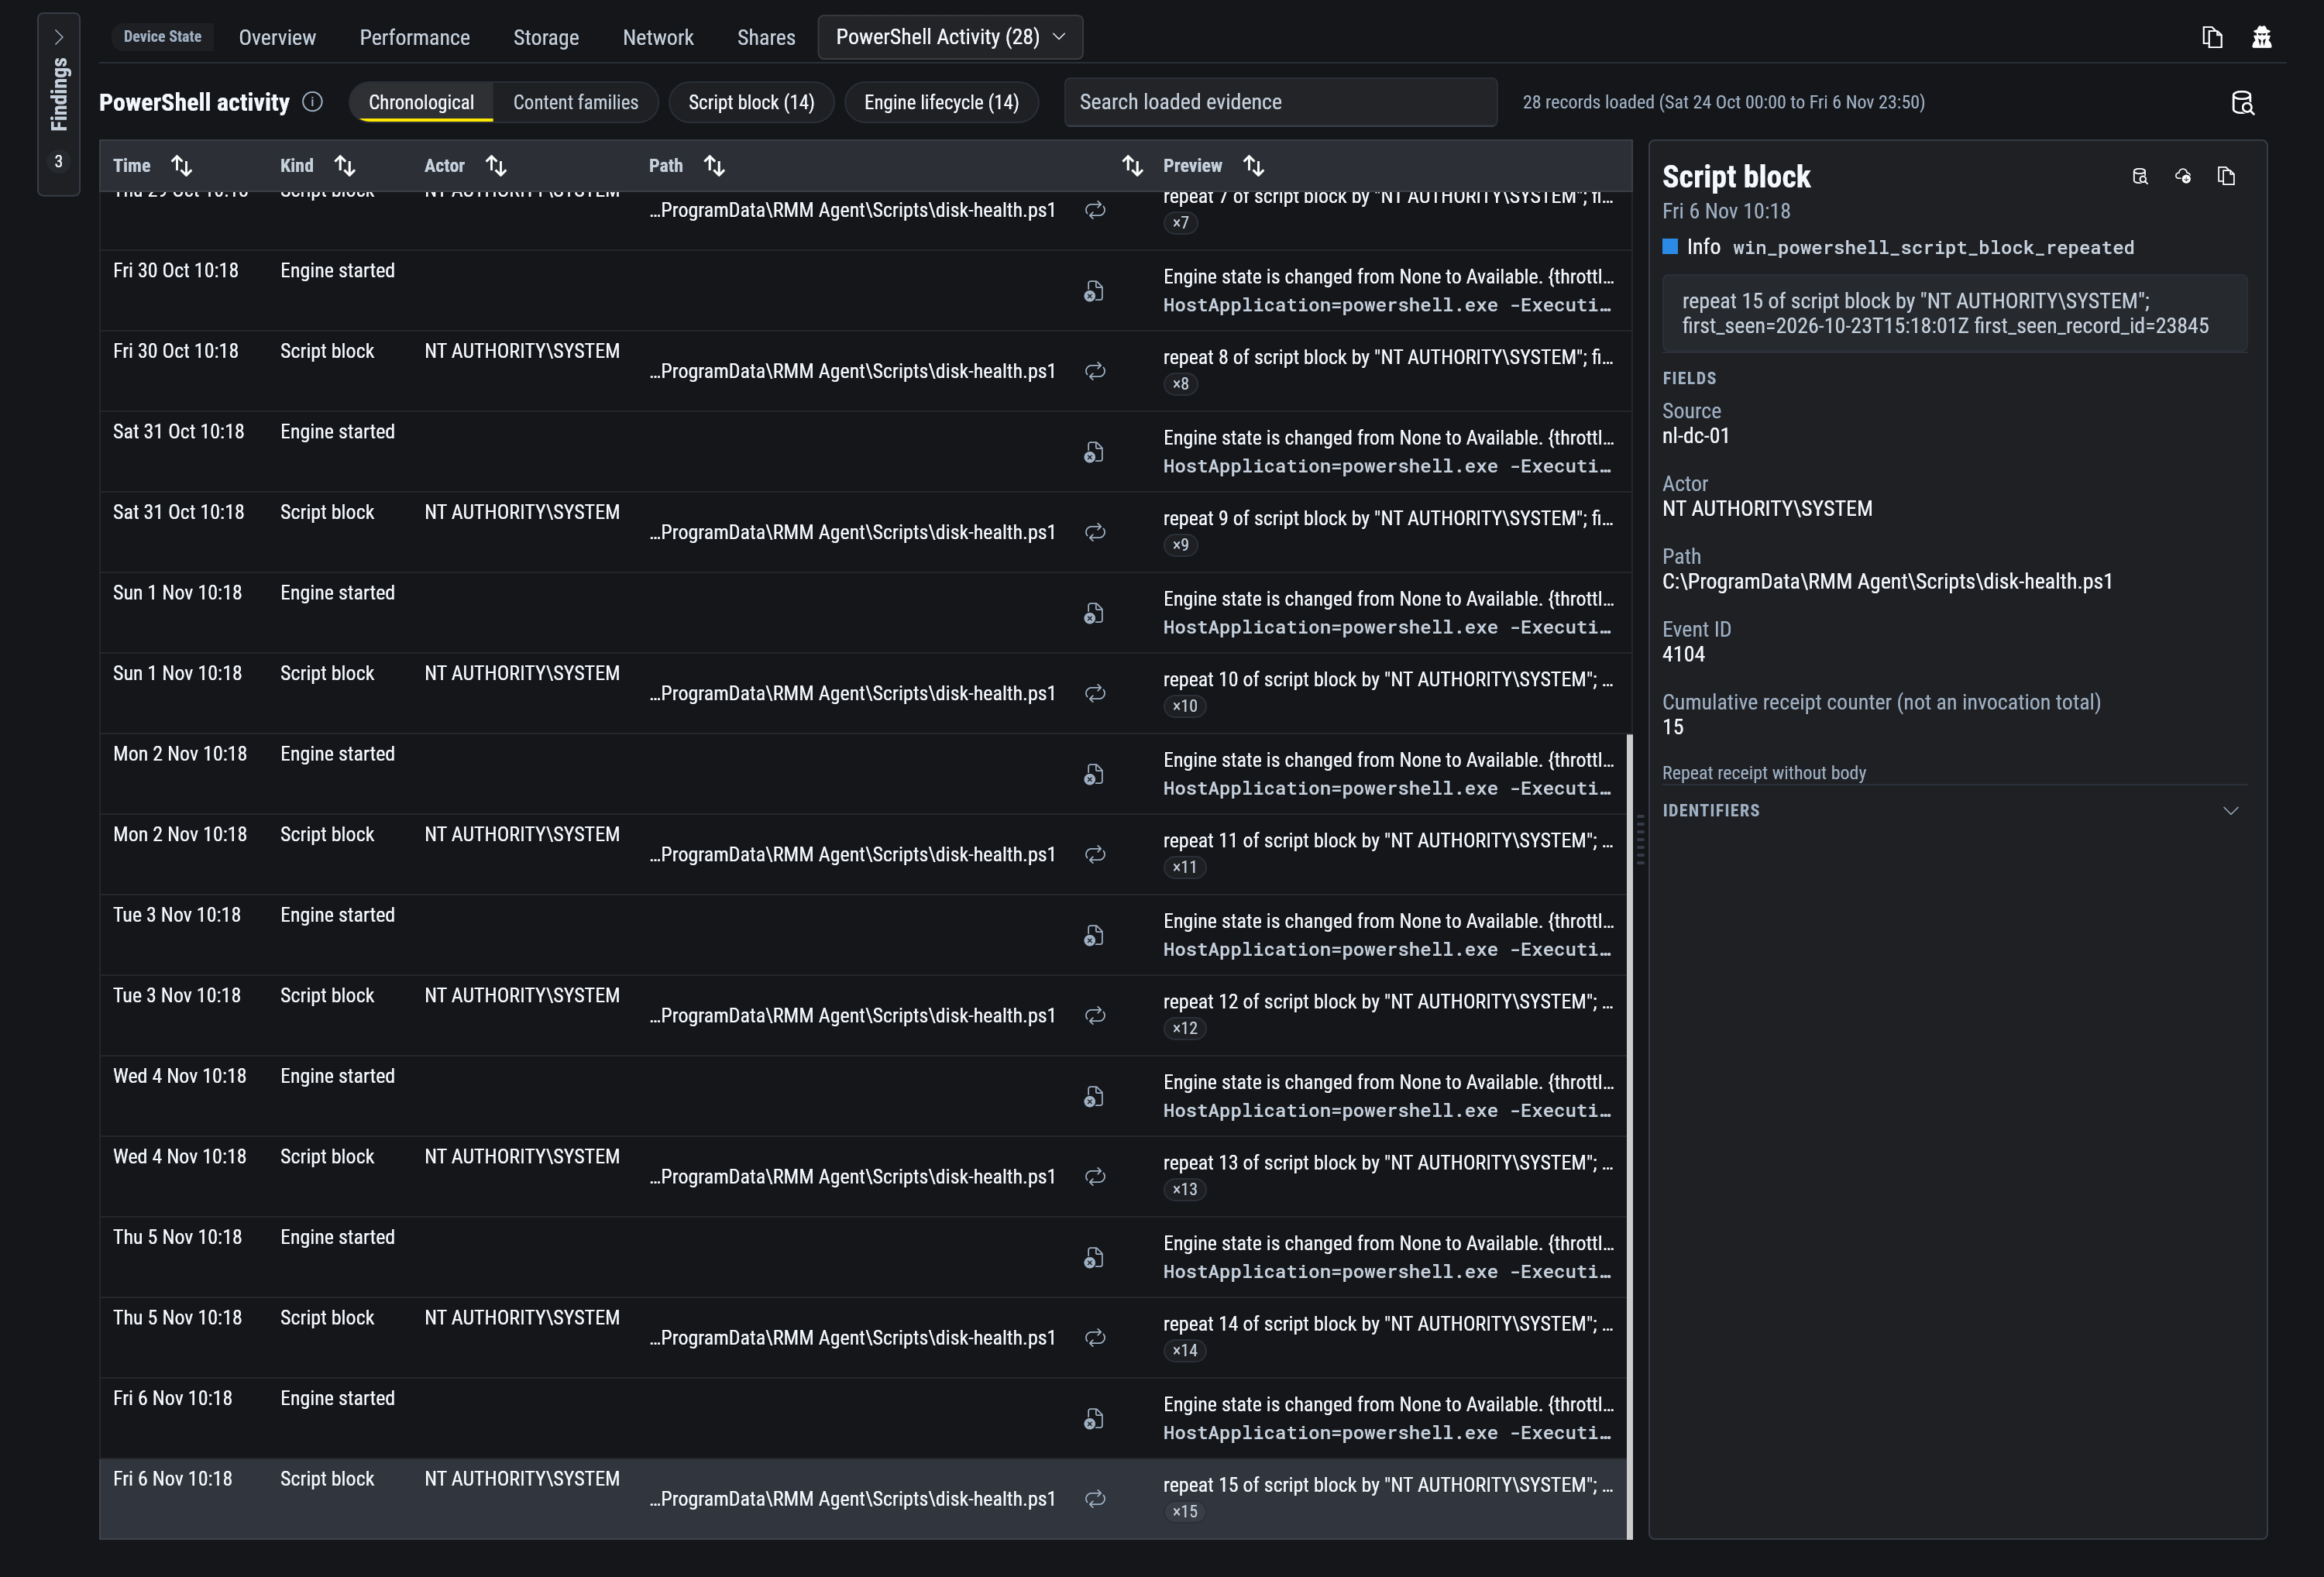
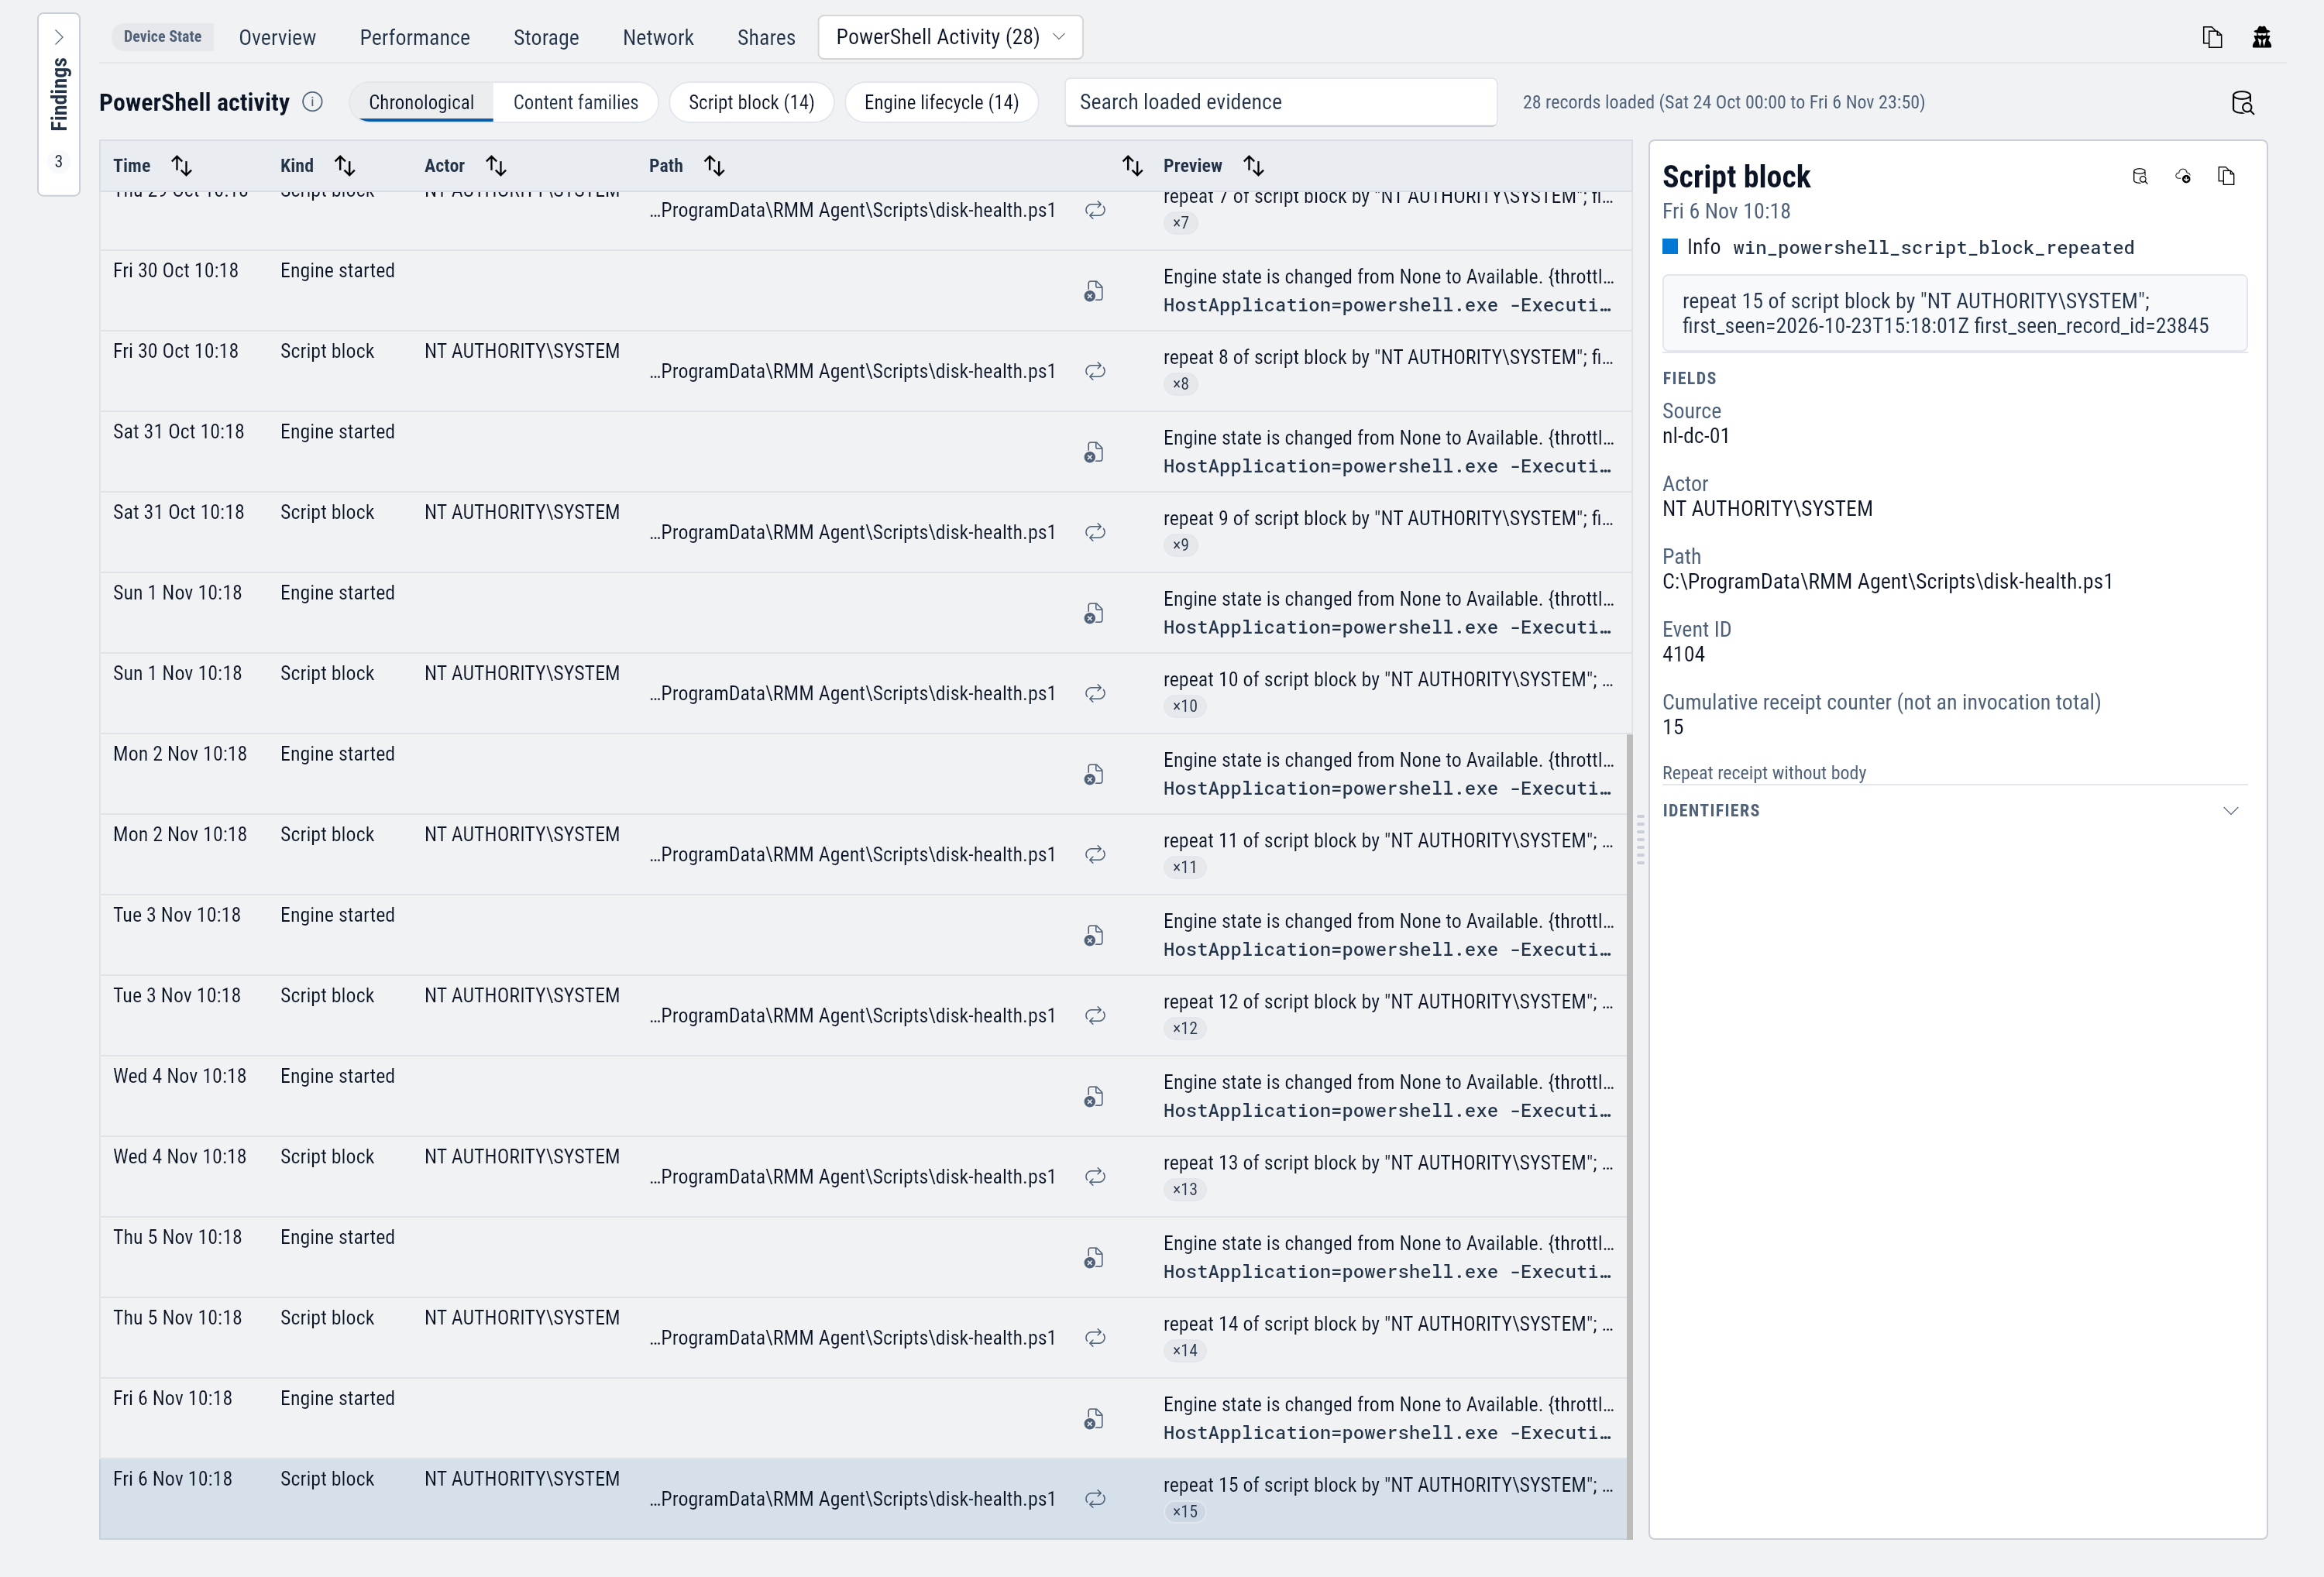
Each row shows the time, the account, the script's path and a preview of what it did. Chronological lists records in order. Content families groups records that are the same script apart from session IDs and temporary names.
A script that runs on a schedule is stored once. Later runs within 14 days appear as repeats with a count and no body, and Go to first copy opens the stored script.
A record's details show why it stood out, when it did: content from a watchlist, signs of obfuscation, or base64 content, which is shown decoded. A recorded script block does not show that the script ran to the end or what it returned.
Signals
Signals counts the window's events by reason, application, service and subsource, with a column for each severity. A reason is the name SparkLogs gives a curated event, such as sign in failed.
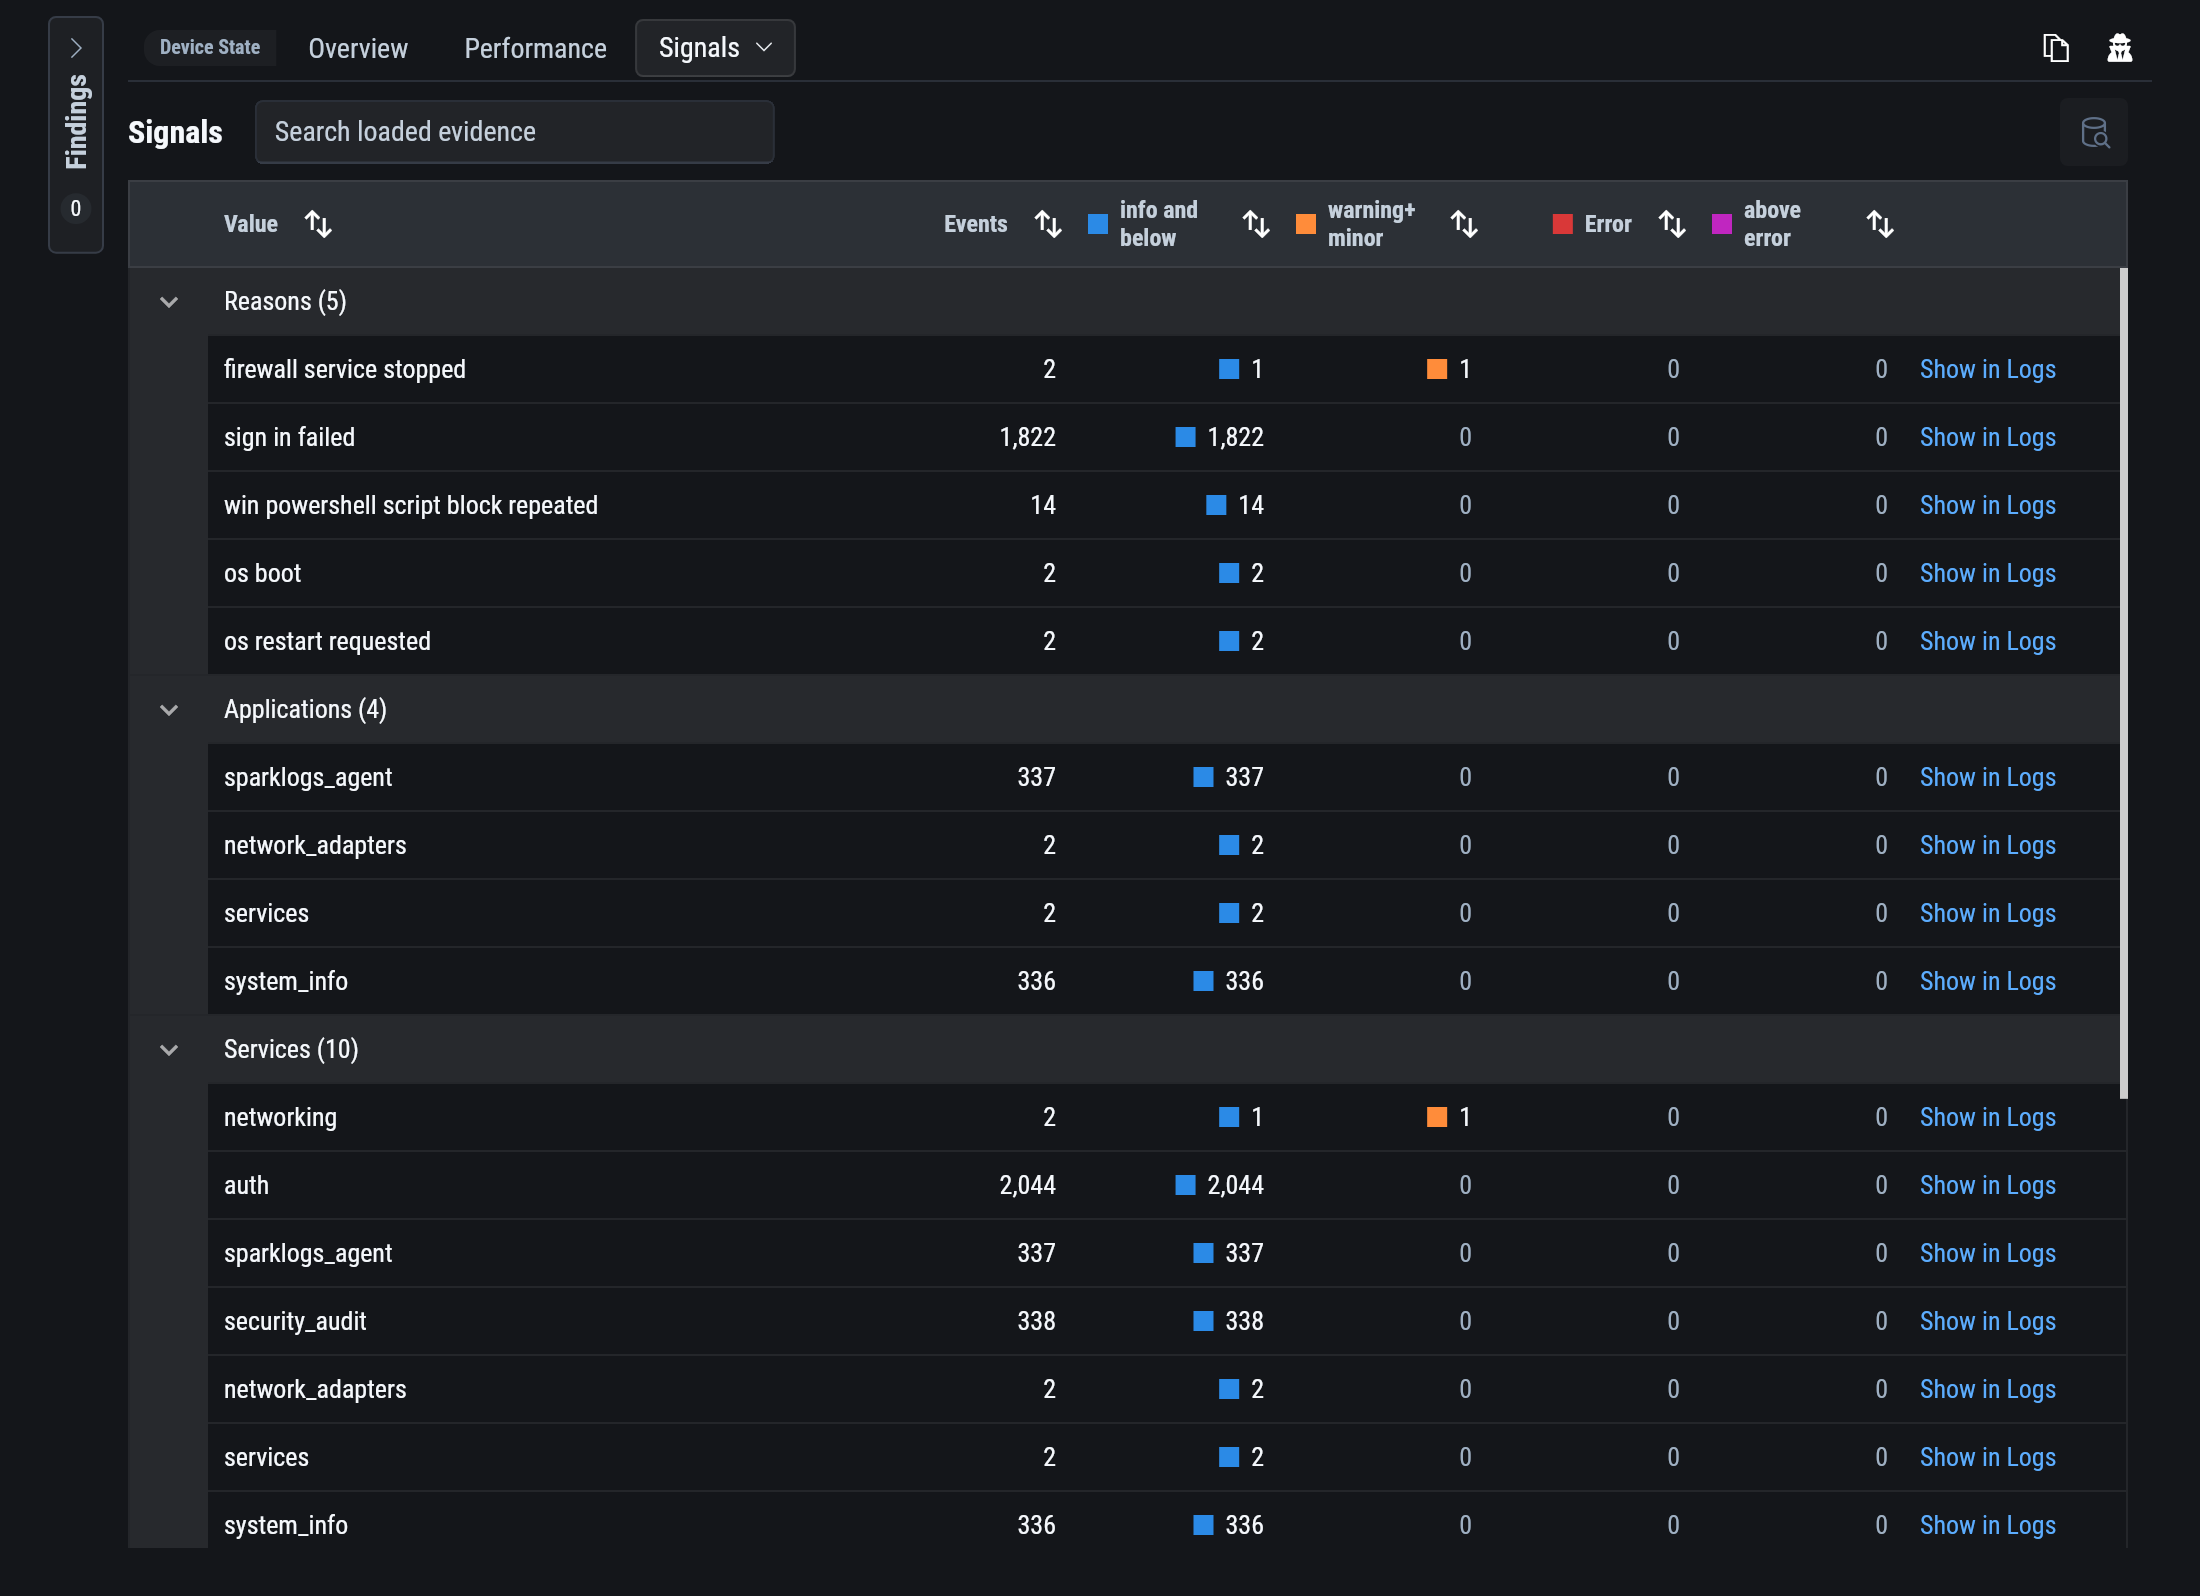
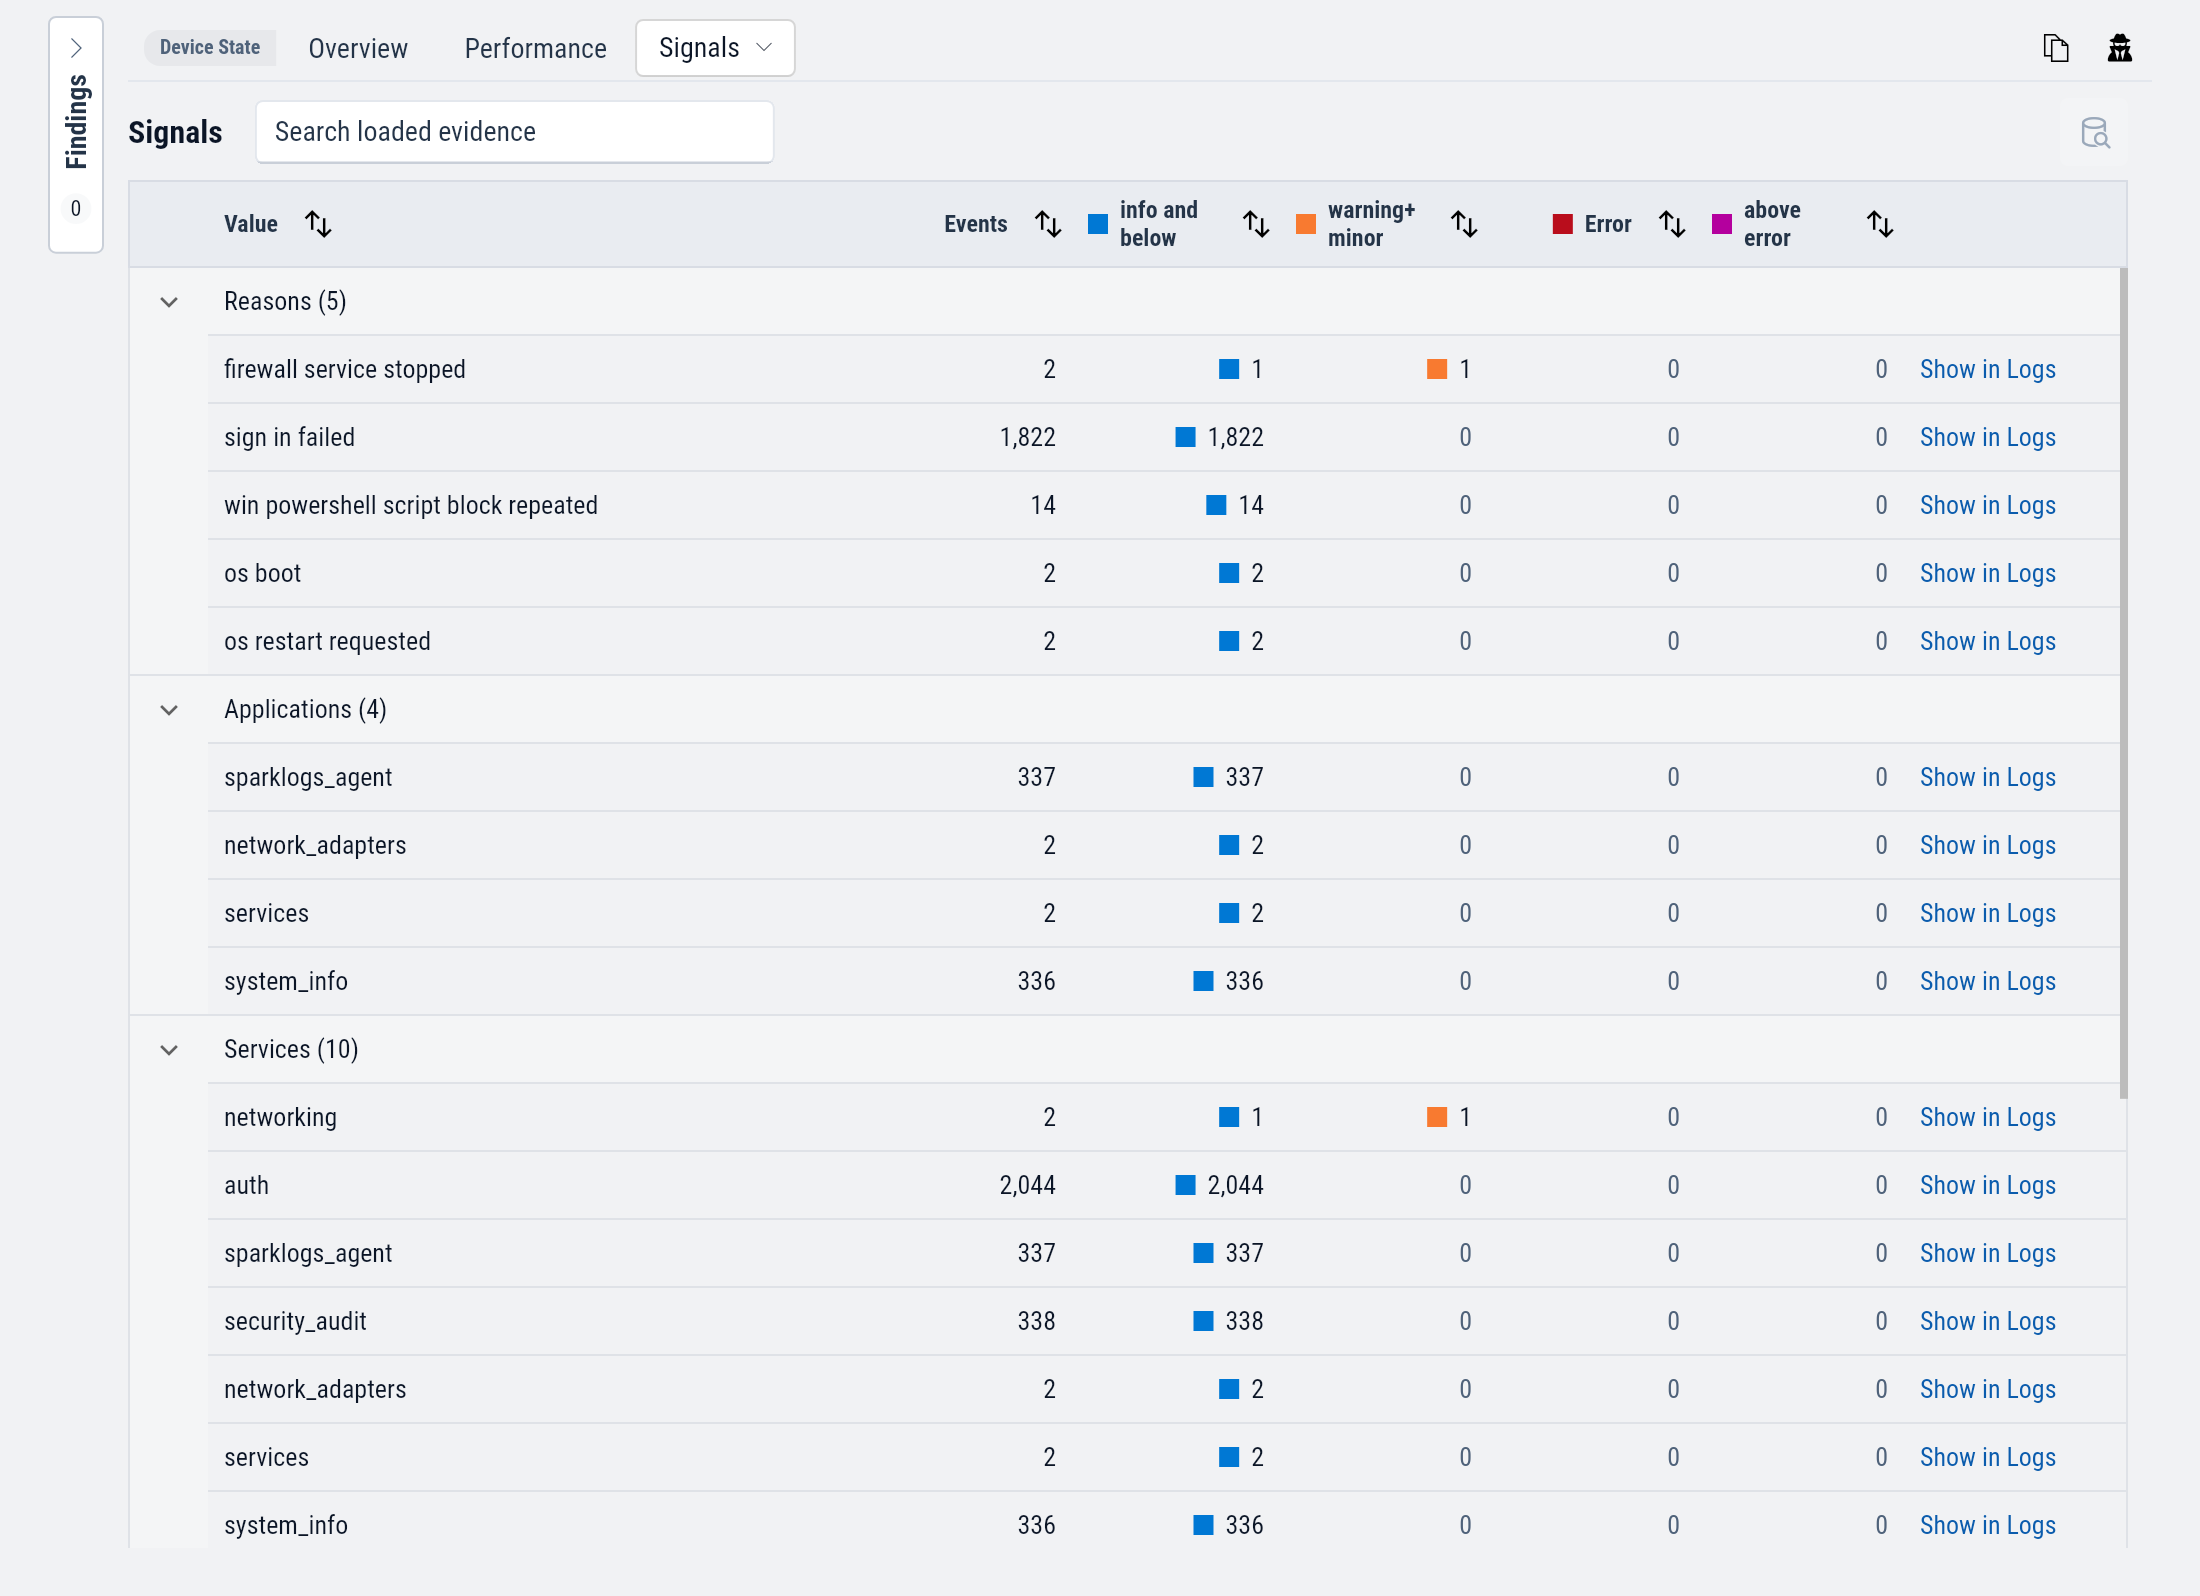
Use it to see which reasons and services produced the most events, and the most serious ones, before reading any single event. Show in Logs on a row opens that reason's or service's events on the Logs tab.
One event can count under a reason, an application and a service, so the groups overlap.
Example: failed sign-ins on a remote PC
An AI answer says wb-pc-04 at Westbrook Design had many failed sign-ins this week.
Open wb-pc-04 and select Signals.
Under Reasons, sign in failed has 1,822 events, far more than any other reason.
Above it, firewall service stopped has 2 events, one of them at Warning or Minor.
Select Show in Logs on the sign in failed row.
The Logs tab lists the events, and the chart shows when they came.
Each one is a failed network sign-in for Administrator with a bad password, and the origin address changes from row to row.
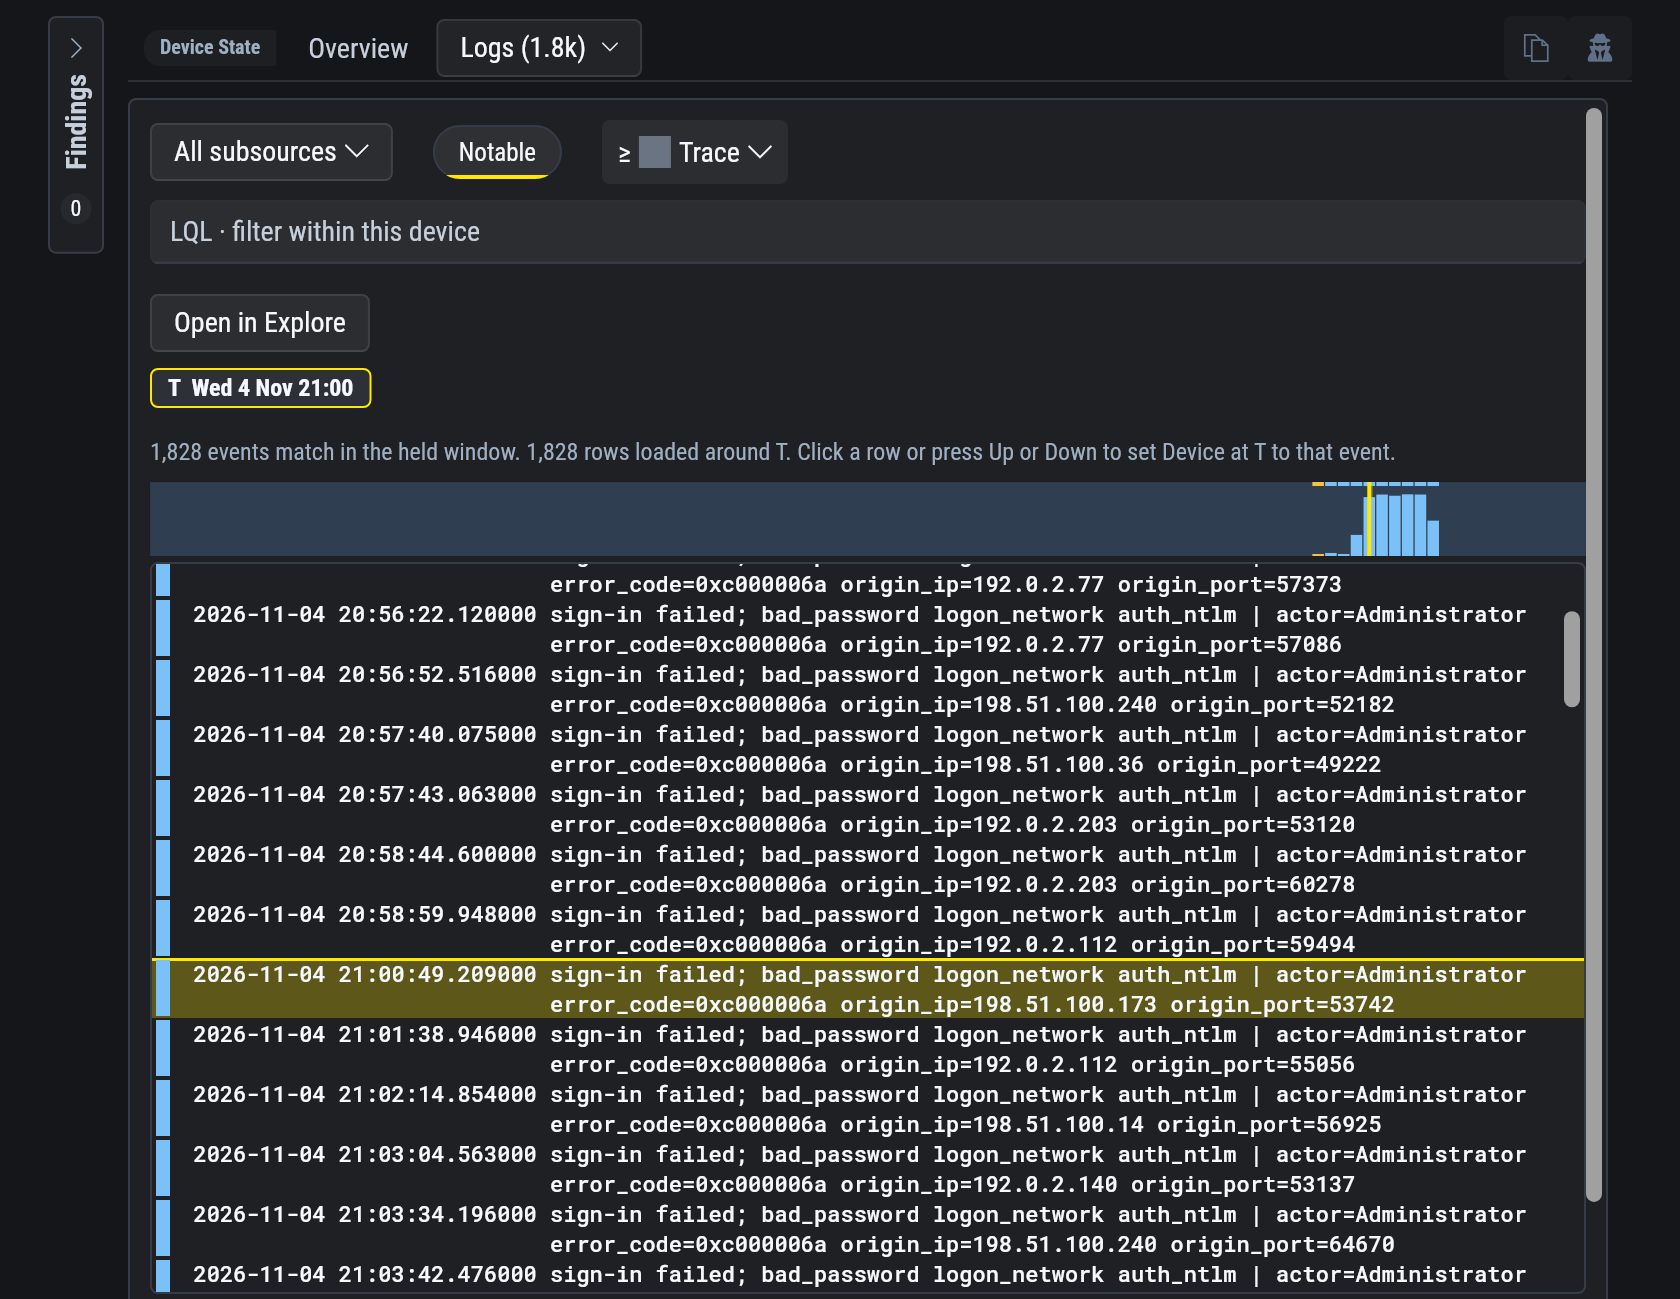
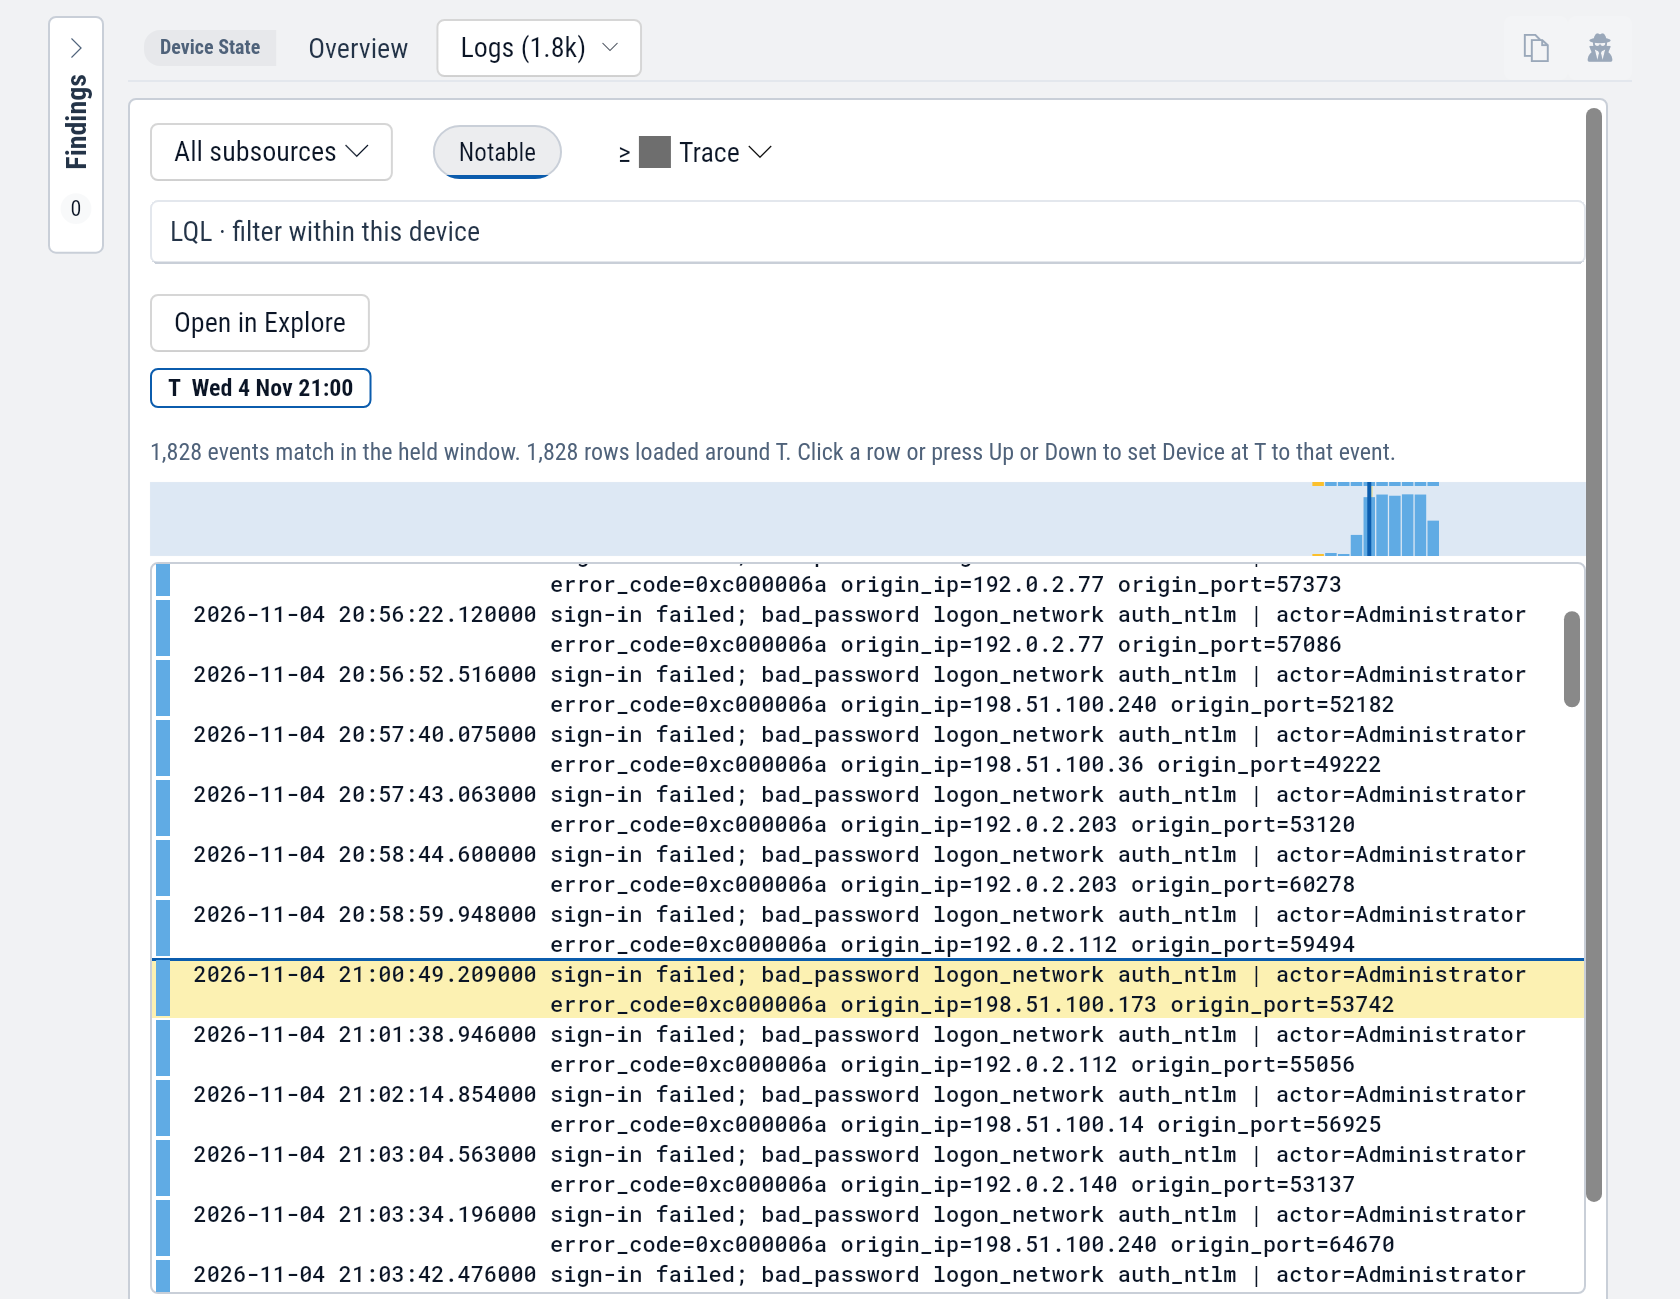
Click where they begin to move T there, then compare that time with the firewall service events. A firewall service that stopped before the sign-in attempts began is the first thing to rule out.