Performance
The Performance tab of the device timeline charts the device's CPU, memory, disk and network over the window. Every chart shares one time axis, and hovering any of them names the processes behind the reading at that time.
The agent samples the device every 10 seconds and reports in 5-minute periods. A chart can show each period's worst 10 seconds beside its average, so a short spike is not averaged away.
The summary cards
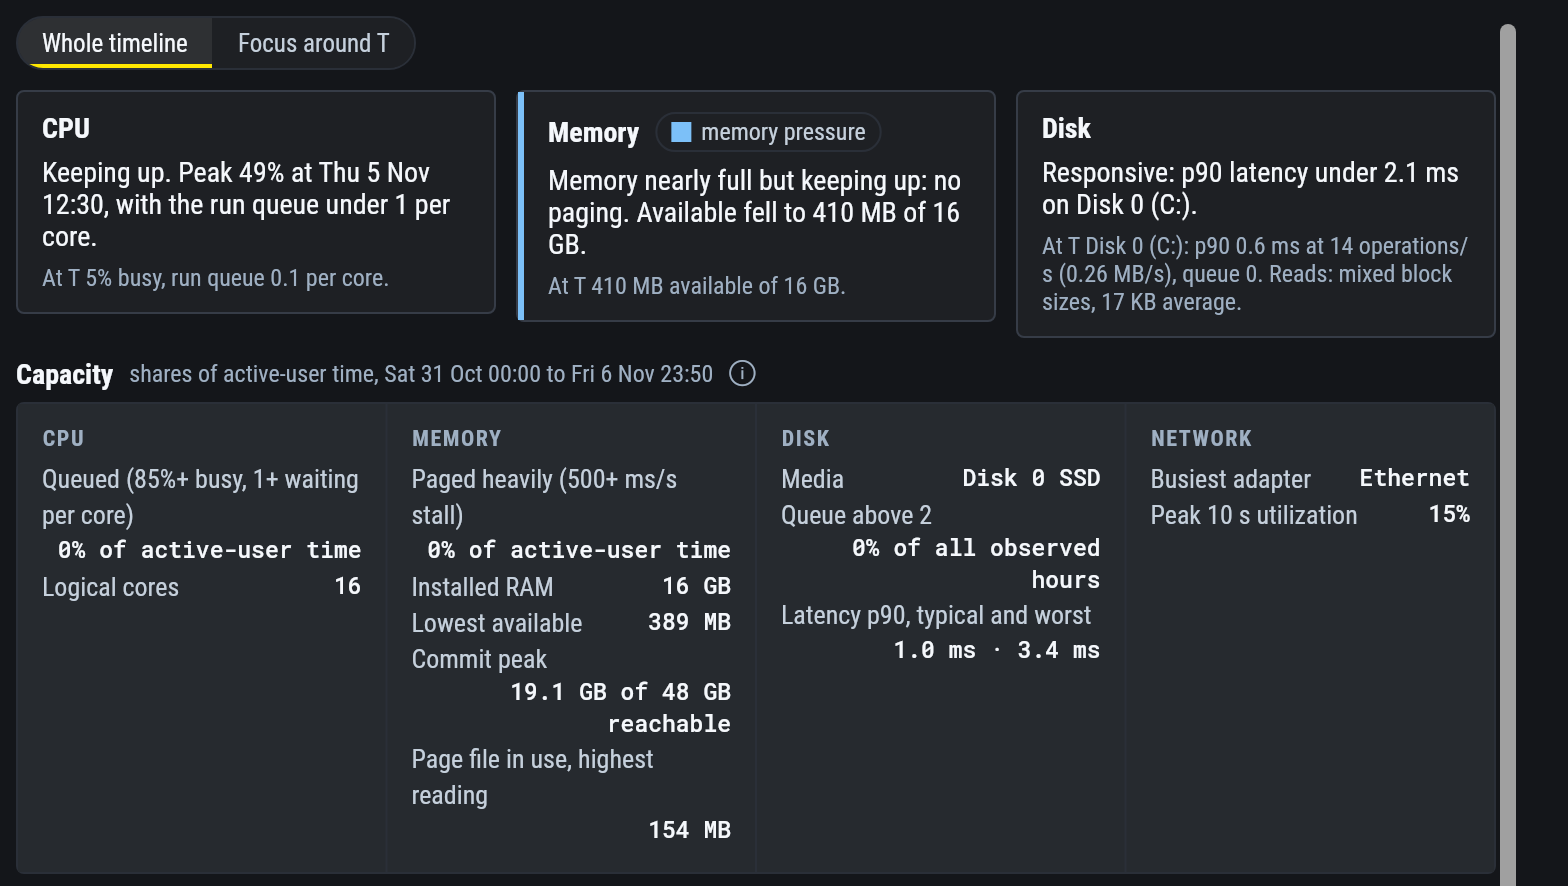
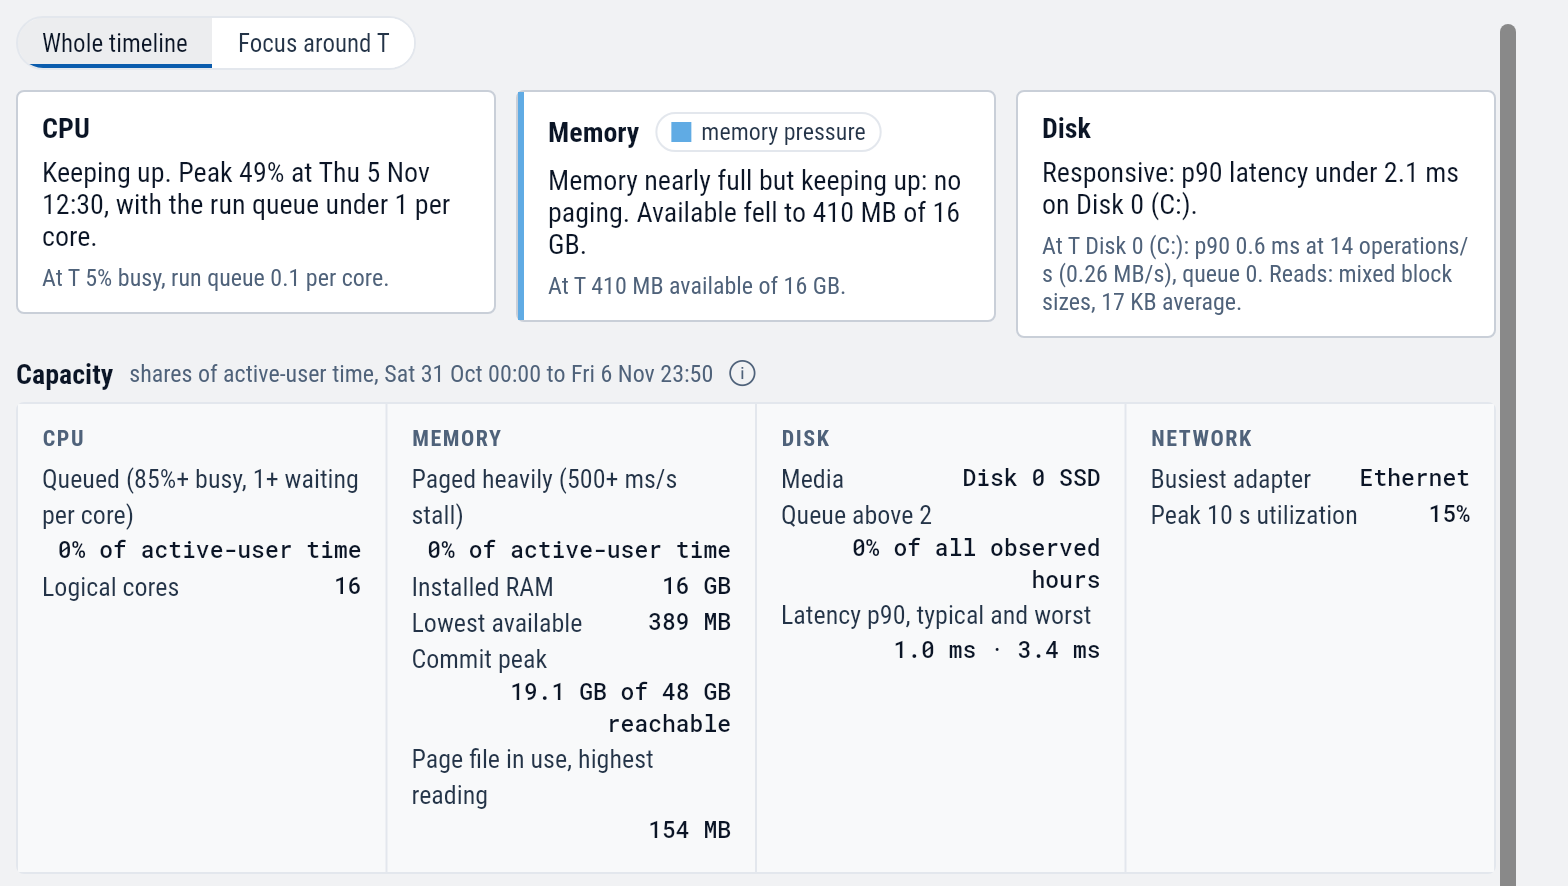
Three cards at the top sum up CPU, memory and disk in words: one line for the range and one for T.
A card calls a resource slow only while a condition backs it. A CPU at 95% with nothing waiting reads "Pinned but keeping up".
Whether the hardware fits the work
Capacity answers a sizing question: over this range, how much of the time was the device short of CPU, memory or disk?
| Resource | Shows |
|---|---|
| CPU | The share of time the CPU was at least 85% busy with threads waiting for a core. |
| Memory | The share of time Windows was paging heavily, the lowest available memory, and the peak commit. |
| Disk | The share of time the disk queue was above 2, and the typical and worst latency. |
| Network | The busiest adapter and its peak use. |
On a workstation the percentages count only the time someone was signed in and using it. On a server they count every hour. The heading says which.
The charts
| Chart | Shows |
|---|---|
| Processes | The top processes as stacked bands. Chips switch it between CPU, RAM, I/O and Net. |
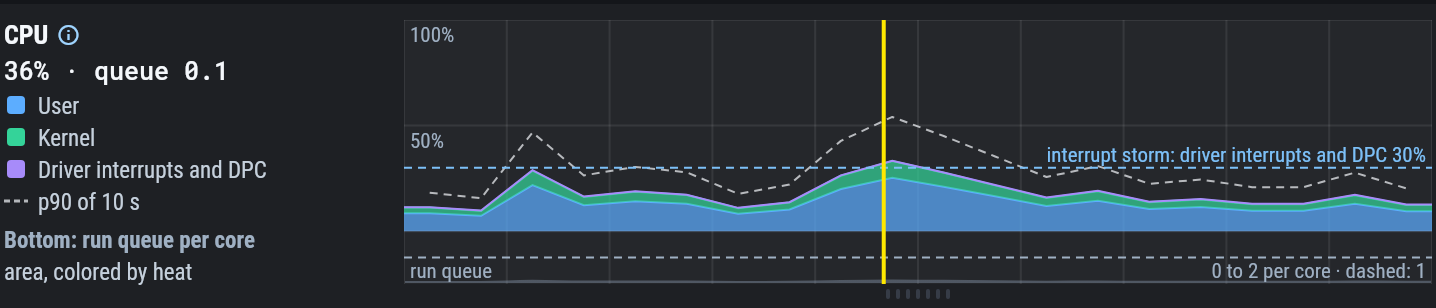
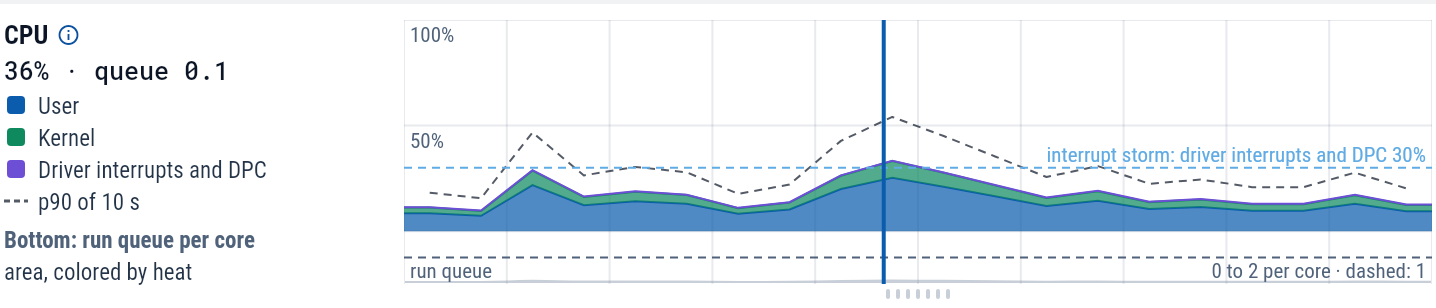
| CPU | User, kernel and driver time. The lane under it is the run queue: threads waiting for a core. |
| Memory | In use, modified and cached memory up to installed RAM. The lane under it is the paging stall: time threads spent waiting on the page file. |
| Kernel memory | The nonpaged and paged pools. |
| Commit | Committed memory against its current limit and the most it can reach. |
| Disk | Reads above the line and writes below it, in MB/s or IOPS, for all disks or one, and split by volume. |
| Latency and queue | Disk latency and the number of requests waiting. |
| Network | Receive above the line and transmit below it, for all adapters or one. By kind splits TCP into LAN, VPN and internet. |
| Path quality, TCP health, Wi-Fi quality | See Network. |
In the lanes under the CPU, memory and latency charts, height is load and color is waiting. Grey means the device kept up. Yellow through red means work was waiting.
A chart appears only when the device reported that data. A period with no data is left empty, and the chart says why: asleep, powered off, or no data.
| To | Do |
|---|---|
| Move T | Click a chart. |
| Zoom | Hold Alt and scroll (a plain scroll moves the page), or hold Shift and drag across a span. |
| Pan | Drag. |
| See the day around T in 5-minute detail | Select Focus around T. It loads 18 hours before T to 6 hours after. |
| Open one resource full screen | Use the full-screen button on its chart. |
| Compare with normal | In full screen, turn on Typical band: this device's usual range over the previous 30 days. |
Which process was it
Hover any chart for a card that lists the top processes at that time for that resource: by CPU, by memory, by disk read and write, or by network receive and transmit. Zoomed out, each process shows its average, its peak and when the peak was.
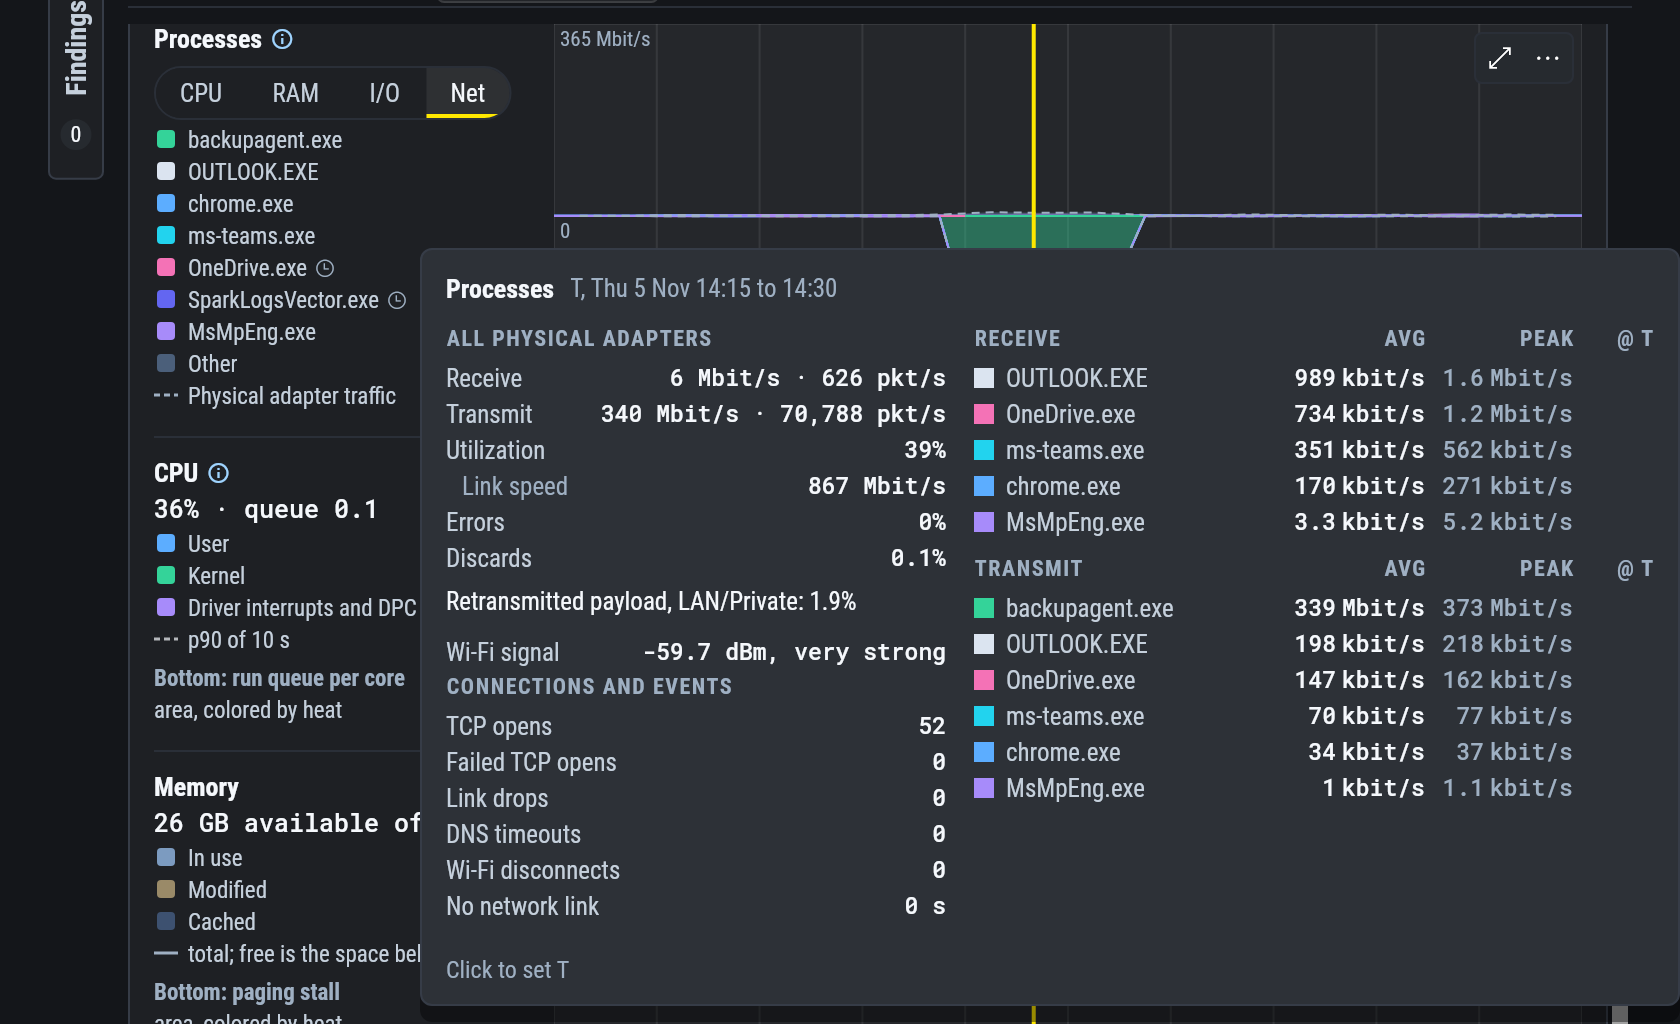
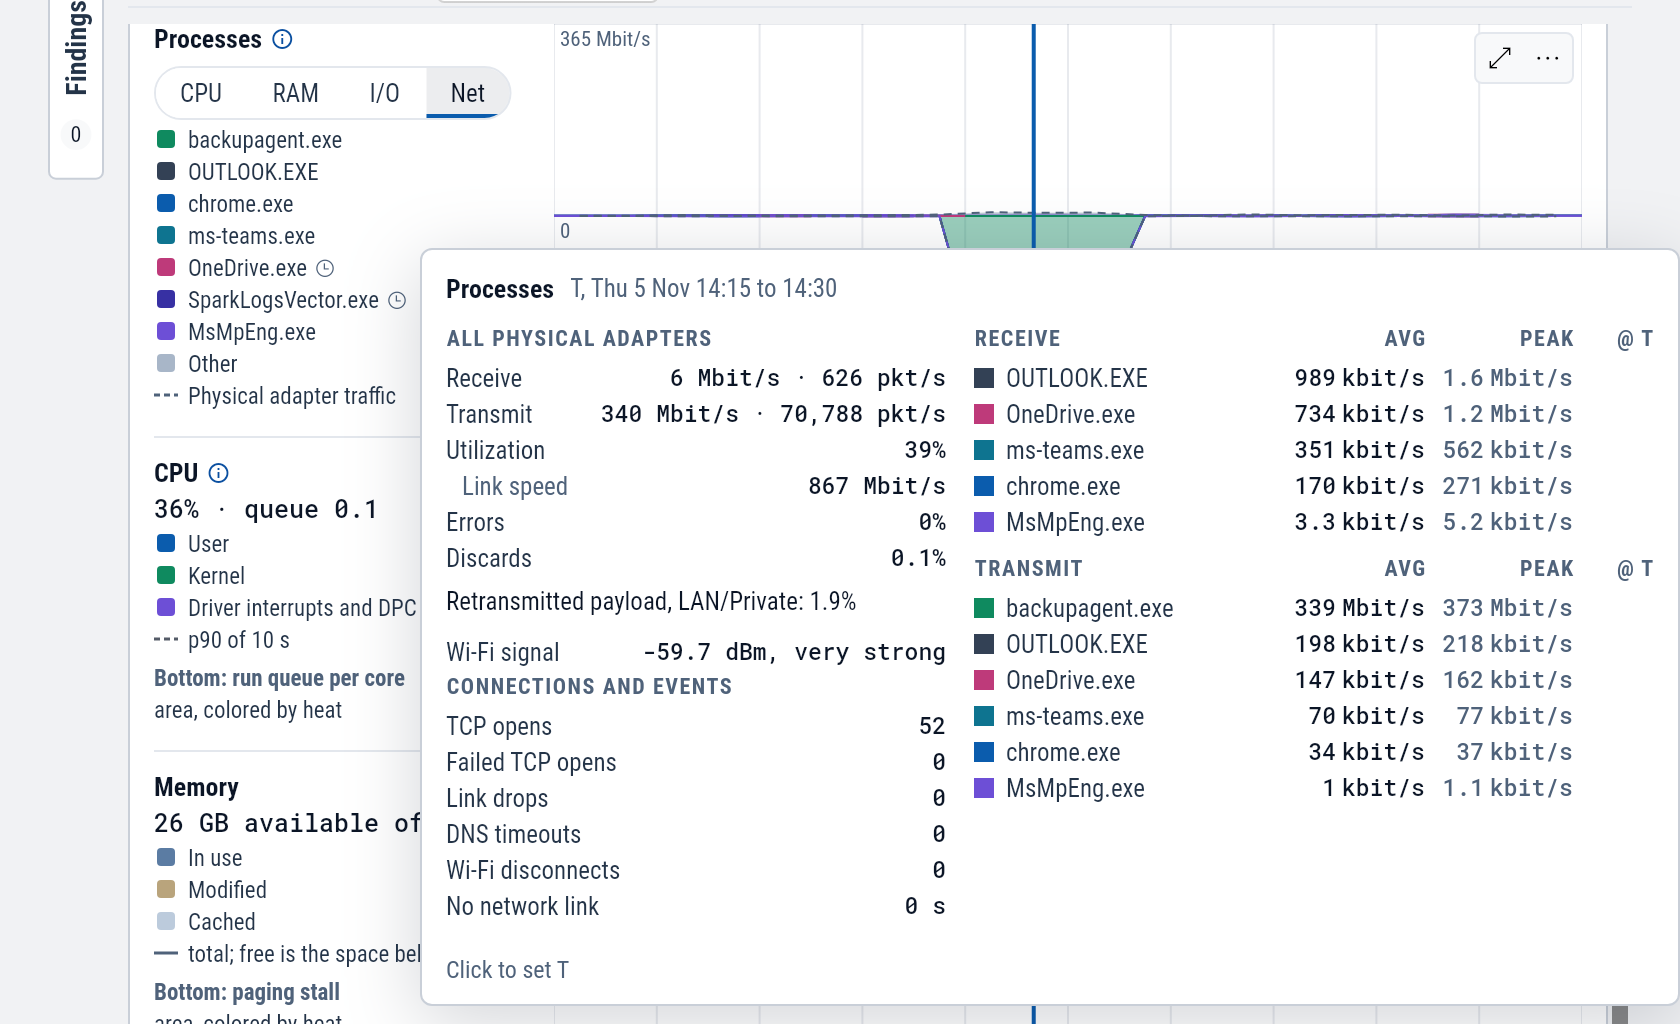
Set the Processes chart, the first one, to Net to see which process filled the line. The colored bands are each process's TCP traffic, and the dashed outline is everything the adapters carried.
Process I/O counts files, pipes, devices and the network, so it does not match the Disk chart exactly.
Top processes under the charts ranks processes at T or by their peak over the range. Top network connections does the same for connections, with each one's process, rates, TCP round trip and retransmits. How much of the remote address is recorded depends on the workspace's network monitoring settings.
Kernel memory by pool tag
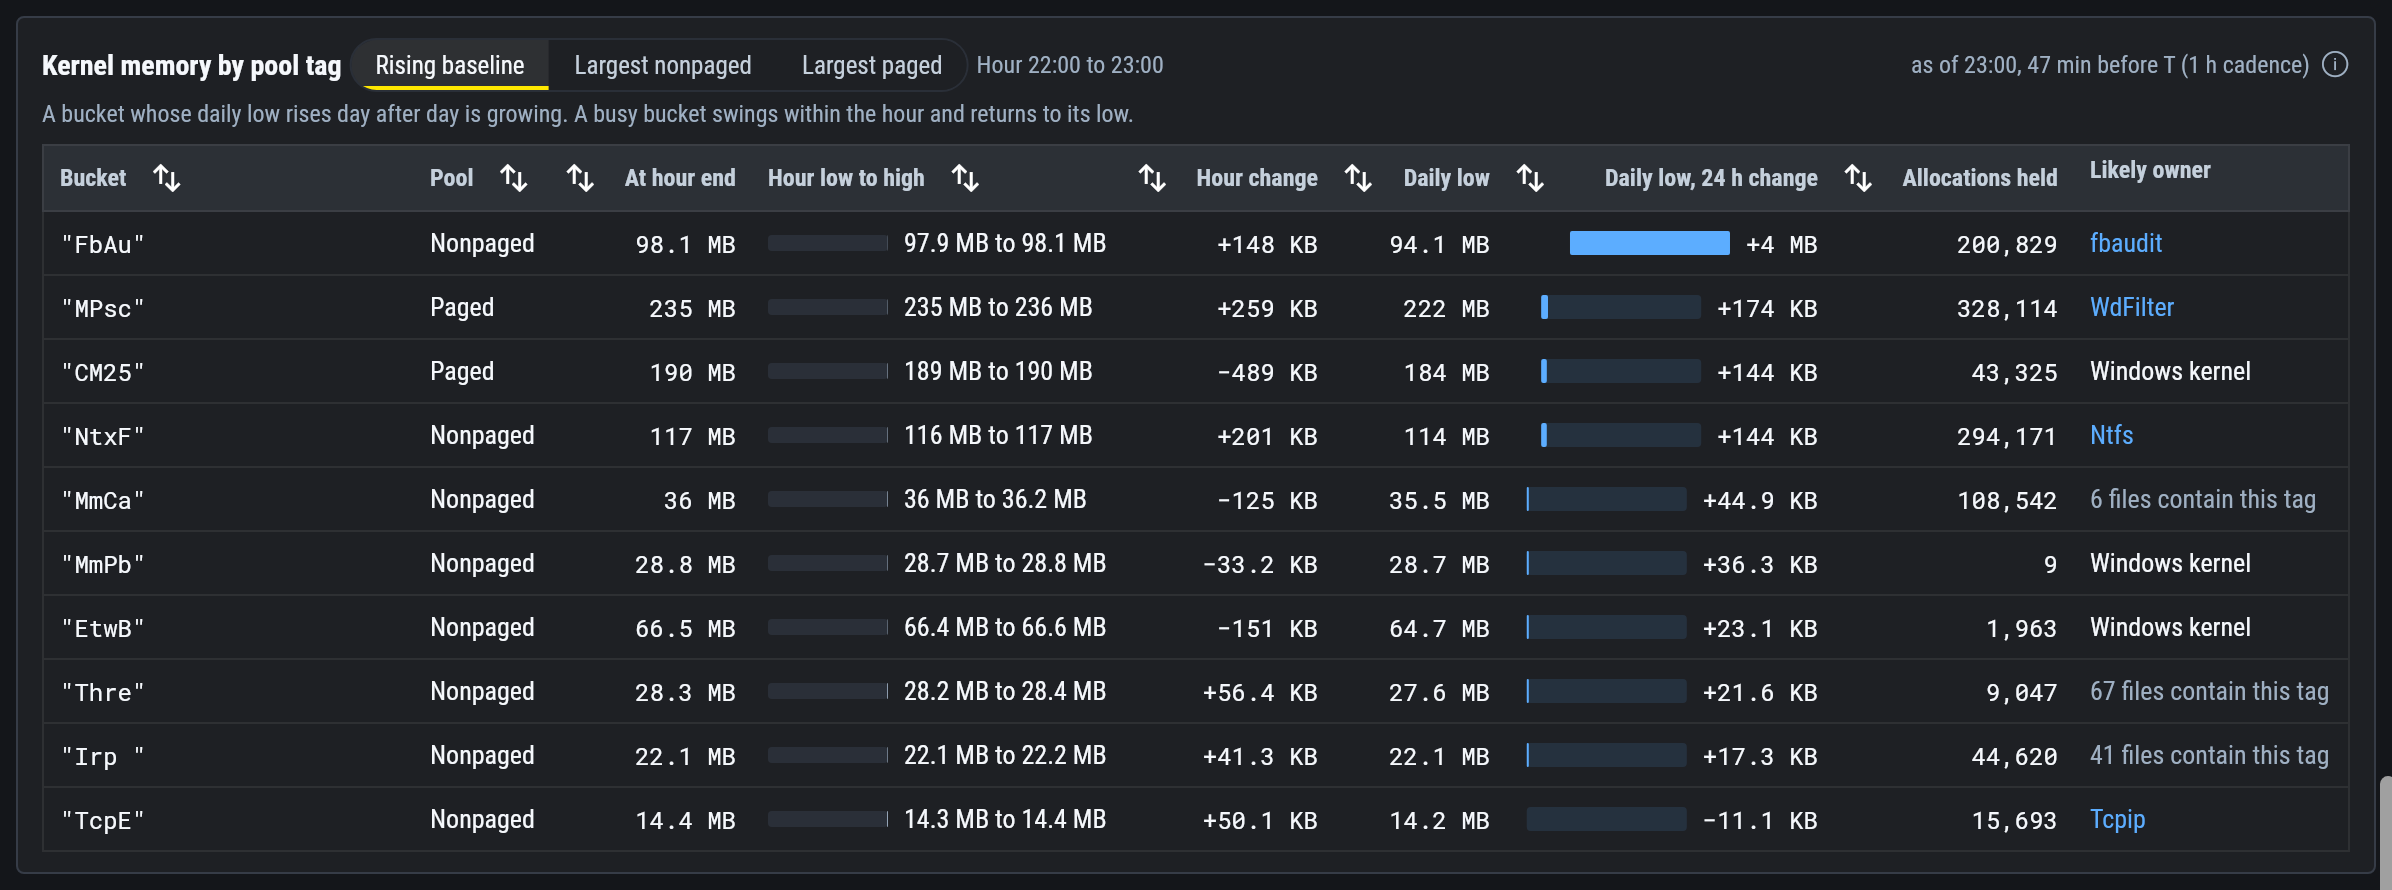
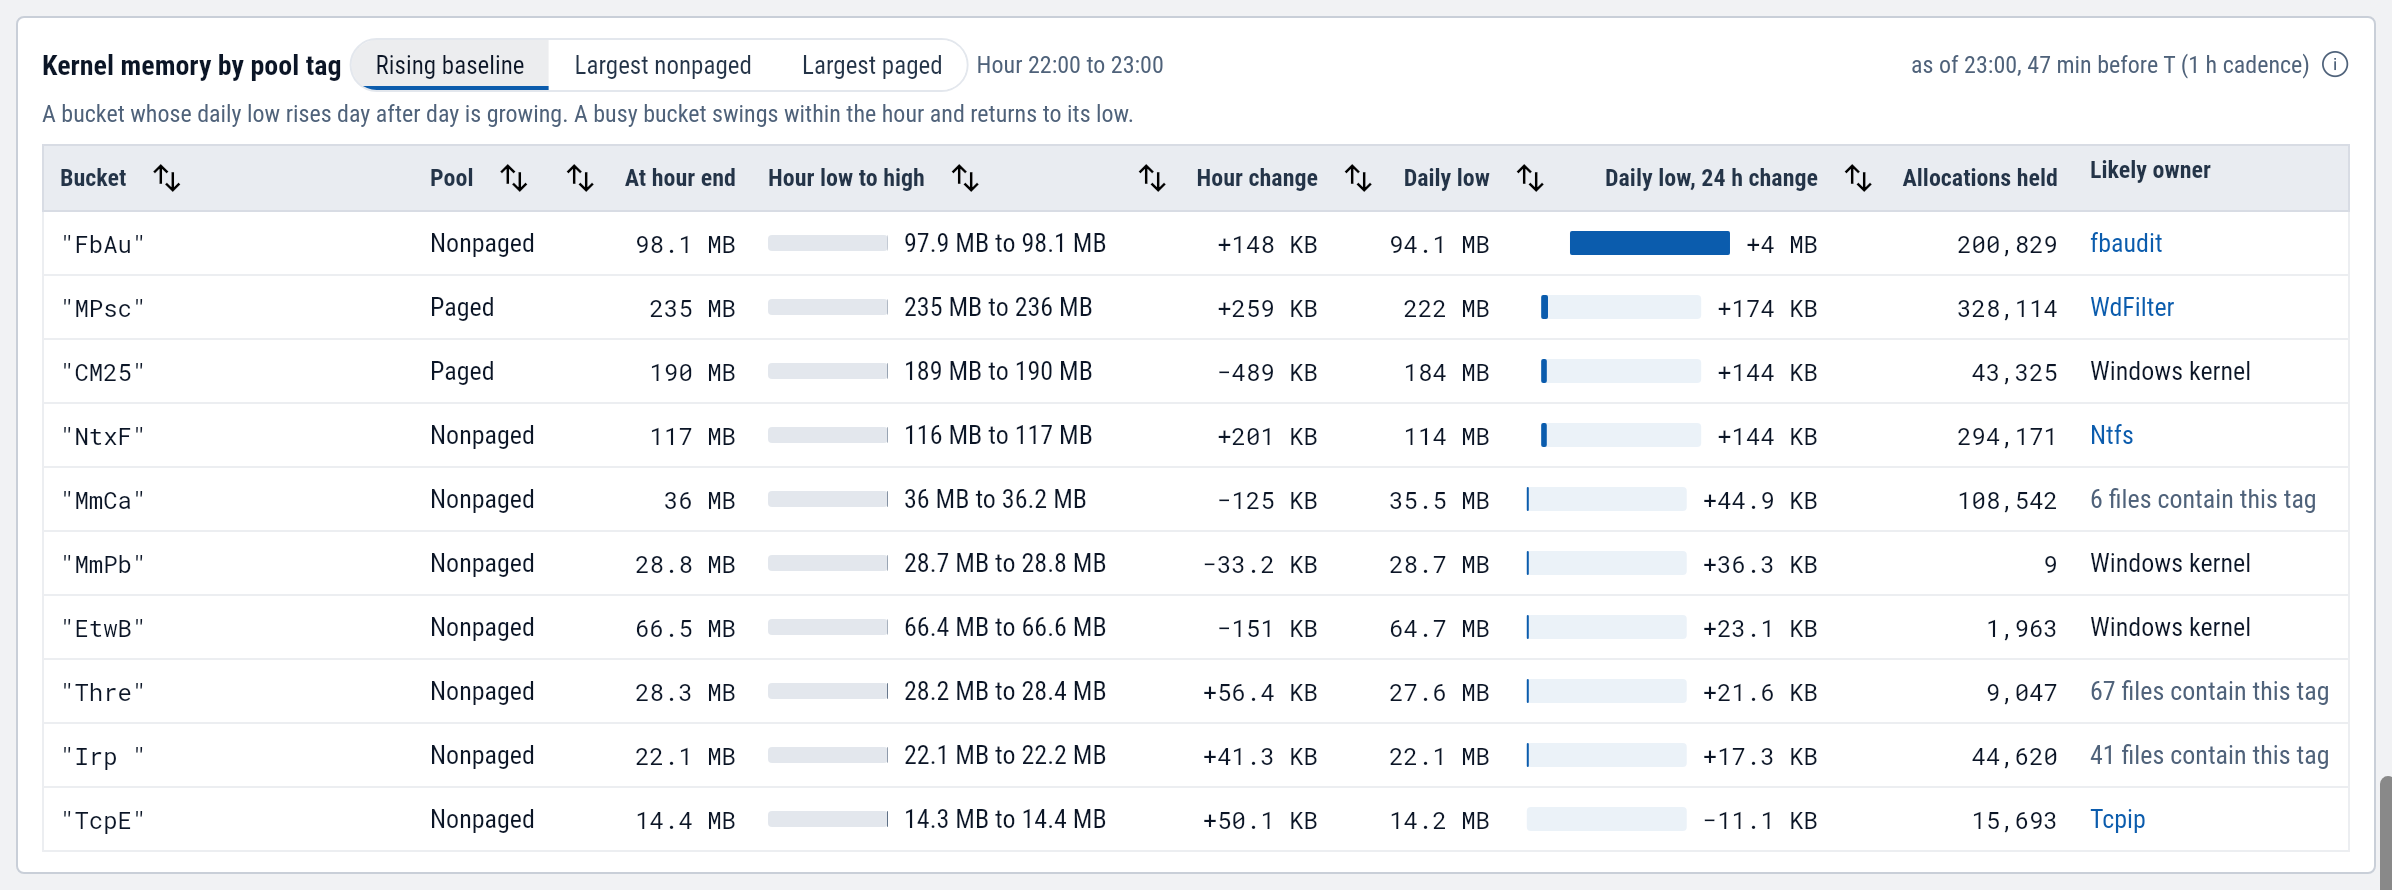
A driver that leaks memory shows in the kernel's pools, which no process owns. Kernel memory by pool tag lists the largest pool tags each hour, and ranks them three ways.
Rising baseline finds the tags whose lowest point each day keeps climbing, which is the pattern a leak makes. A busy tag swings within the hour and returns to its low. The ranking needs 2 days of uptime.
Likely owner names the driver files that contain the tag, with a link to the driver on the Drivers tab. Confirm it before acting, since more than one file can contain the same four letters.
Kernel memory by pool tag needs SparkLogs Agent 1.14.11 or later. Paging stall, commit and active user sessions need 1.13 or later.
Copy for a ticket
Each chart's More menu has Copy for Ticket, which copies the verdict and the periods above normal, and Copy Investigation Prompt for your AI. All captured measurements at the selected time at the bottom of the tab lists every raw reading behind the charts at T.
Example: the afternoon backup at Lakeside Clinic
Lakeside Clinic's front desk Wi-Fi slows every afternoon.
An AI answer points at imaging-03 between 14:00 and 14:40.
Open imaging-03 at 14:20 and select the Performance tab.
Set the Processes chart to Net.
One band fills the afternoon, up to the dashed outline.
Hover it.
Under Transmit, backupagent.exe averages 339 Mbit/s, and every other process is under 1 Mbit/s.
The adapter is transmitting 340 Mbit/s on a Wi-Fi link.
For those forty minutes the backup accounts for nearly everything the adapter sends. The Changes tab shows the backup agent's driver was updated the day the slowdowns began.